
One entry — every report
Scroll down to see how one record becomes a report
EX-01 · Excavator
Loading
Block 1-03 · 06:42:18
Shift
Day · 07:00–19:00
Loading point
Block 1-03
Trips (today)
0
HT-01 · Truck
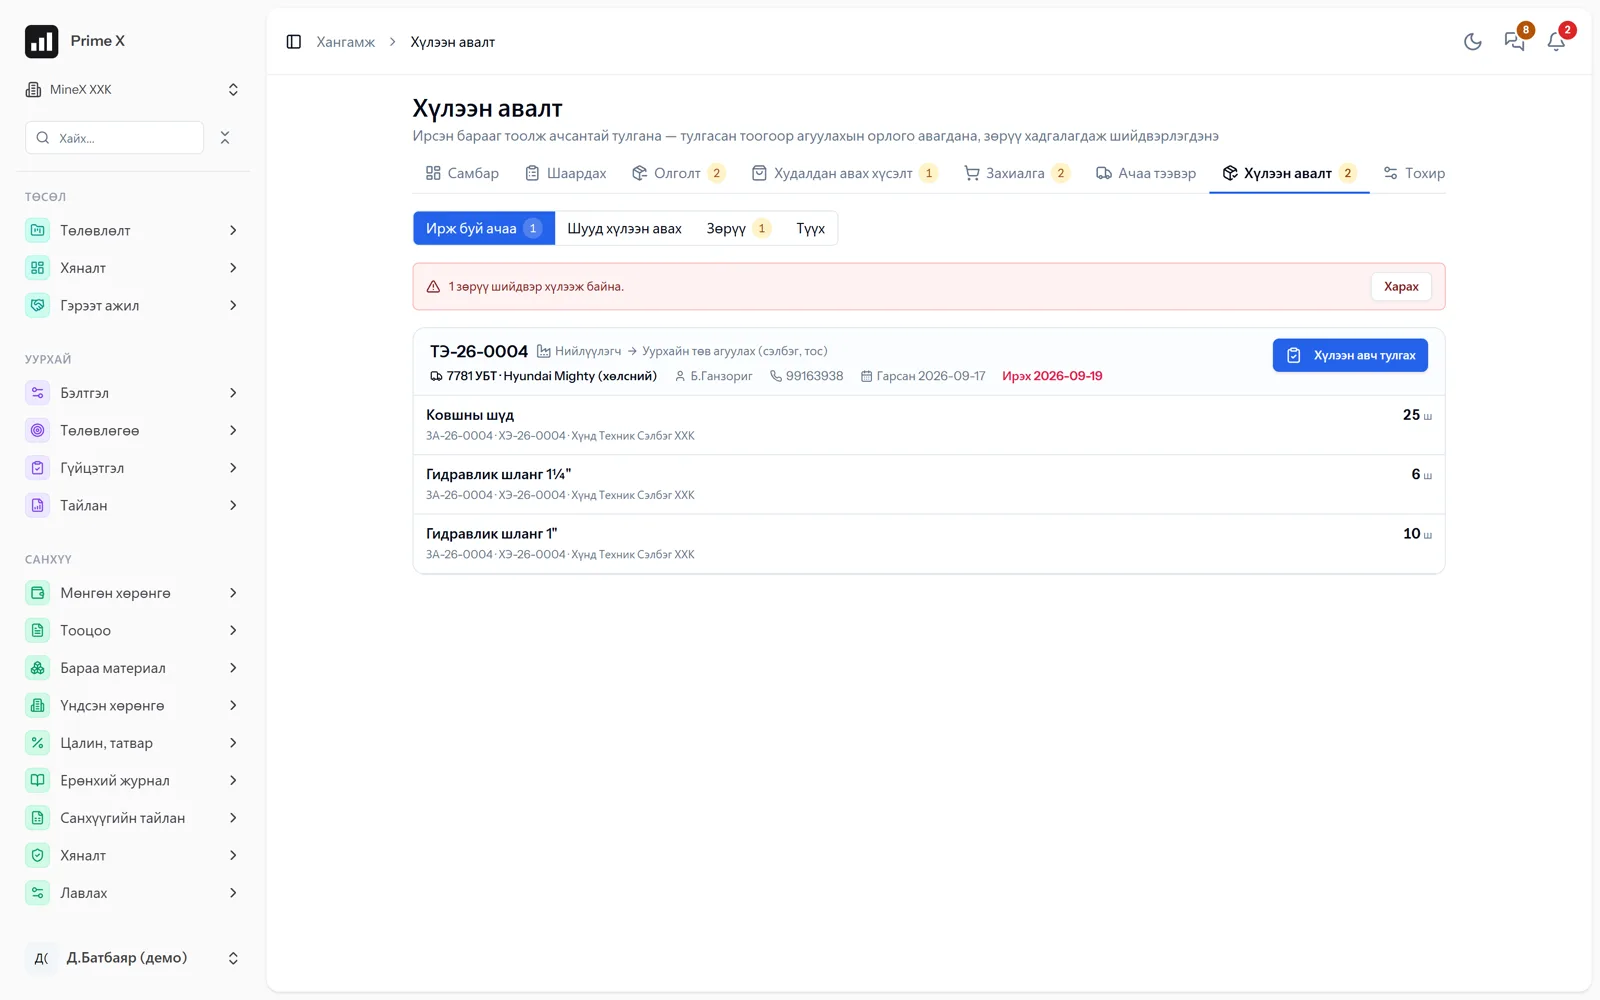
Trip recorded
Block 1-03 → Dump 2 · 55 t
Utilisation · Trips
76.7% · 220
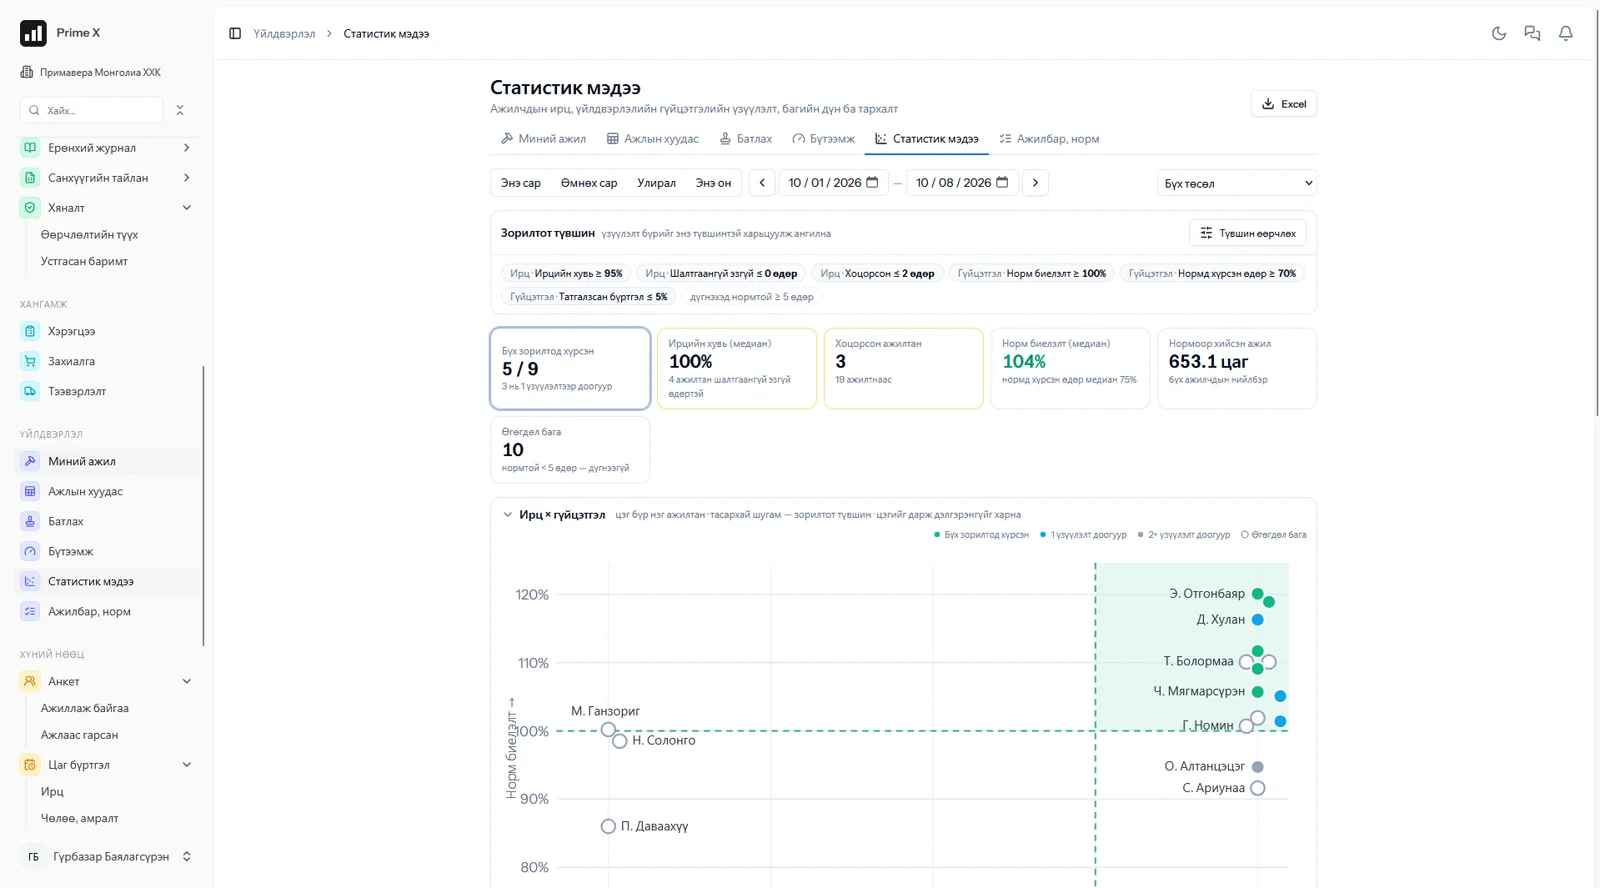
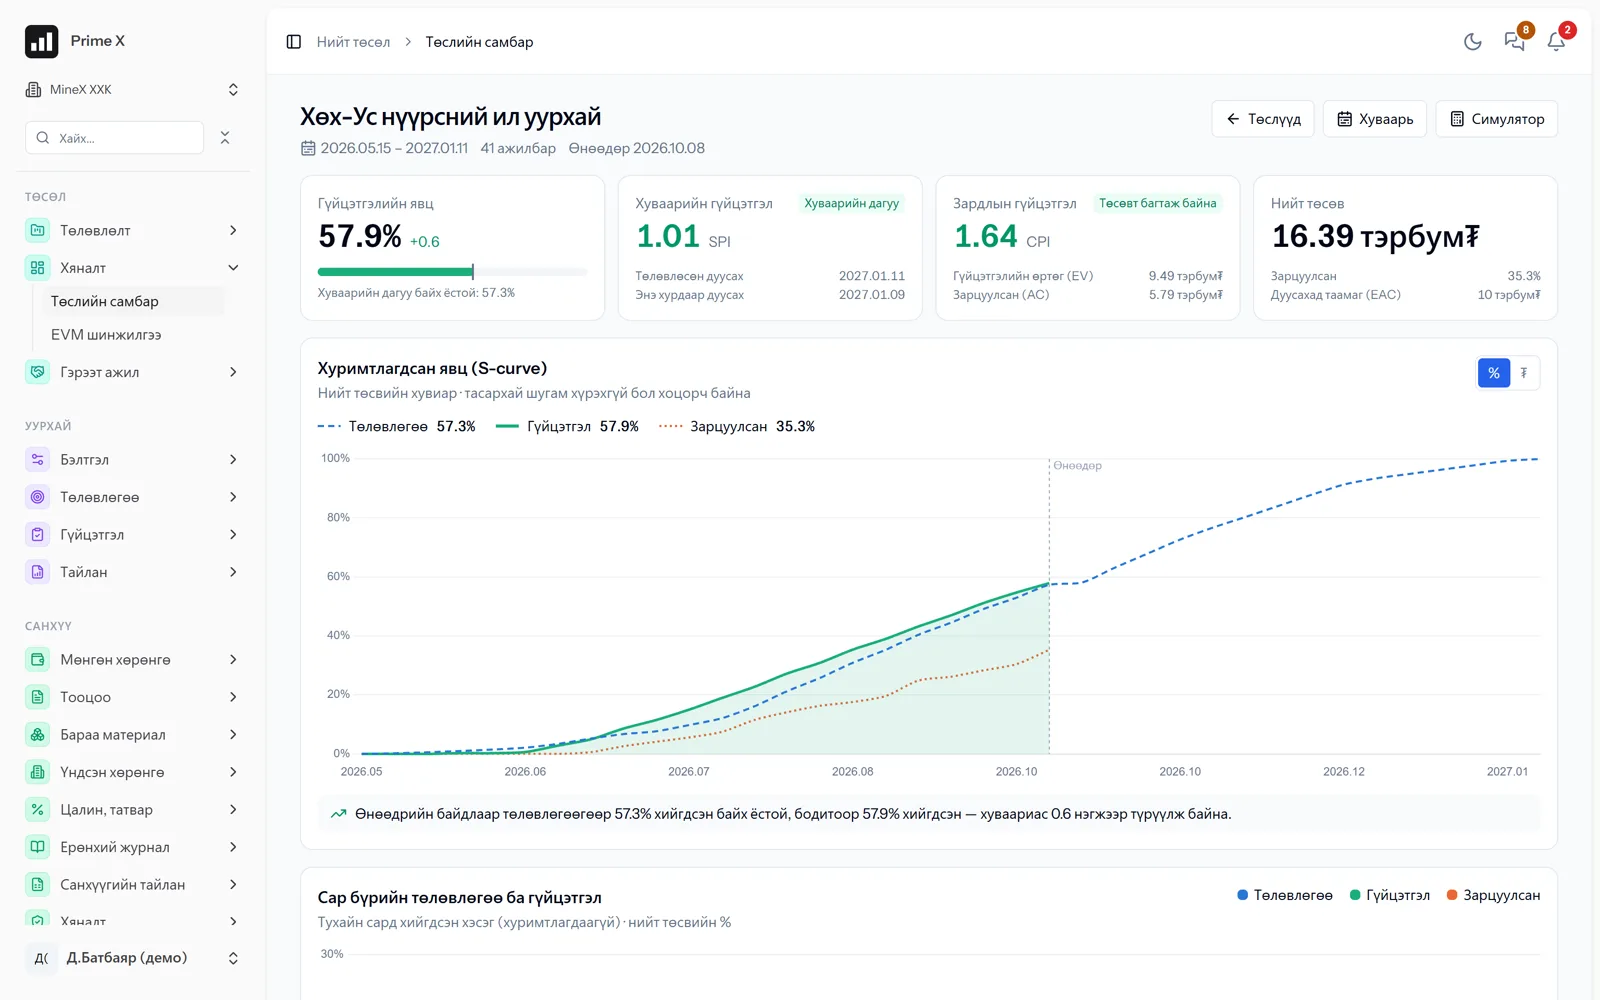
Shift progress in real time
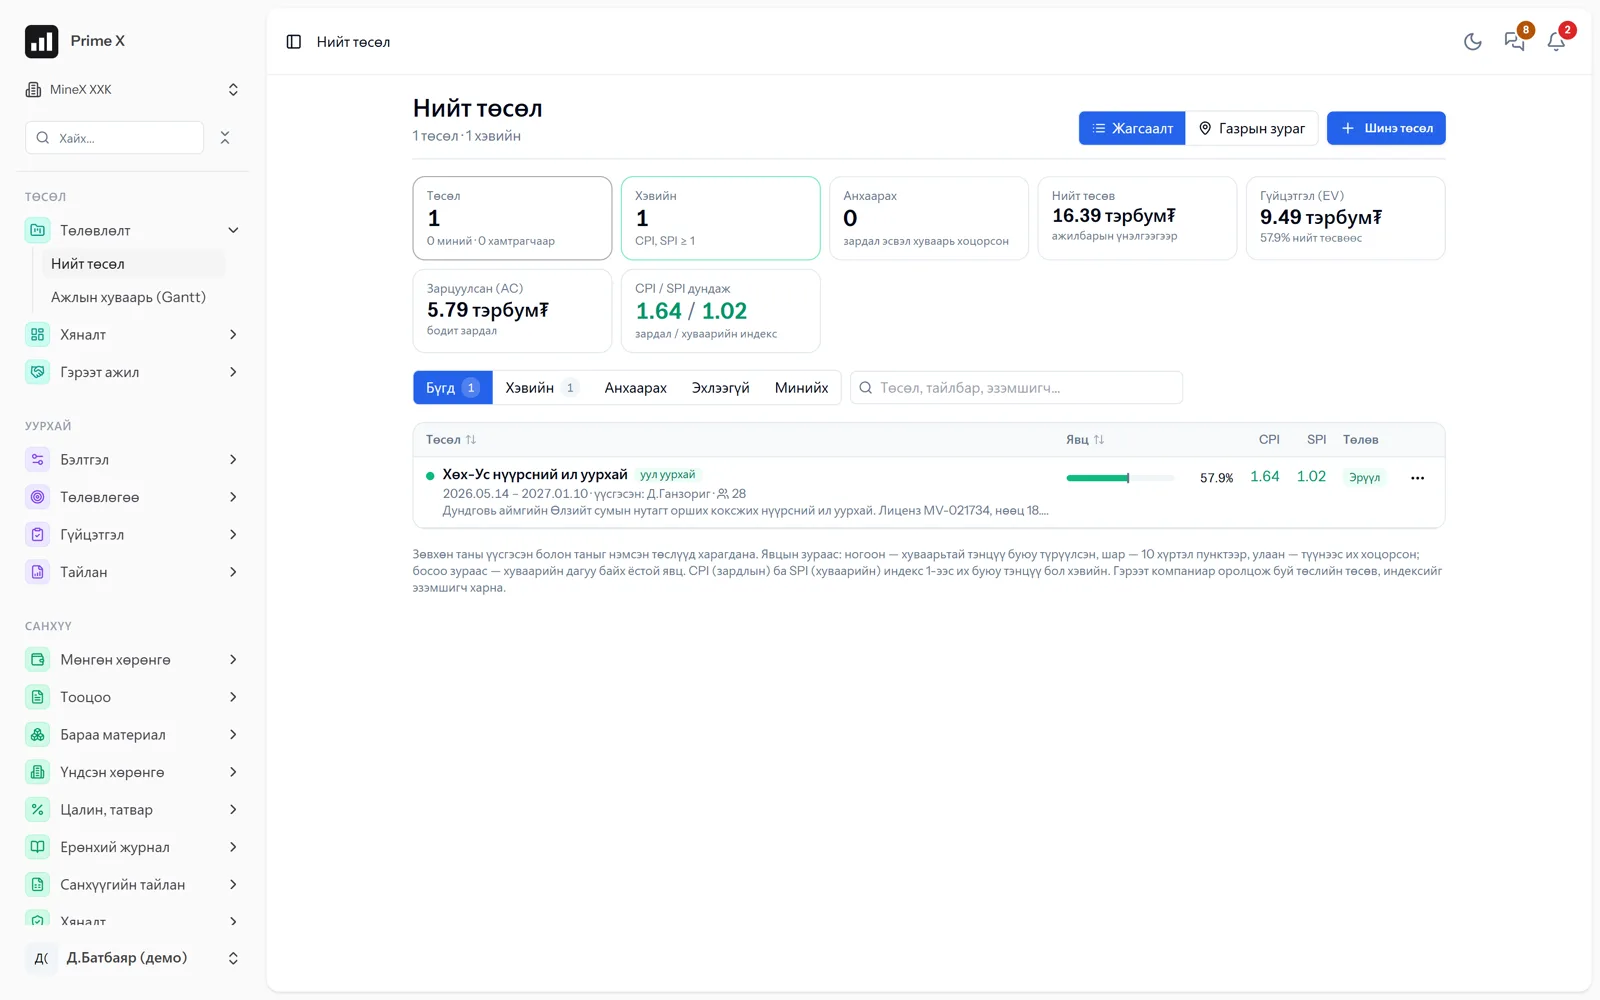
Progress / schedule
57.9% / 57.3%
SPI 1.01 · CPI 1.64
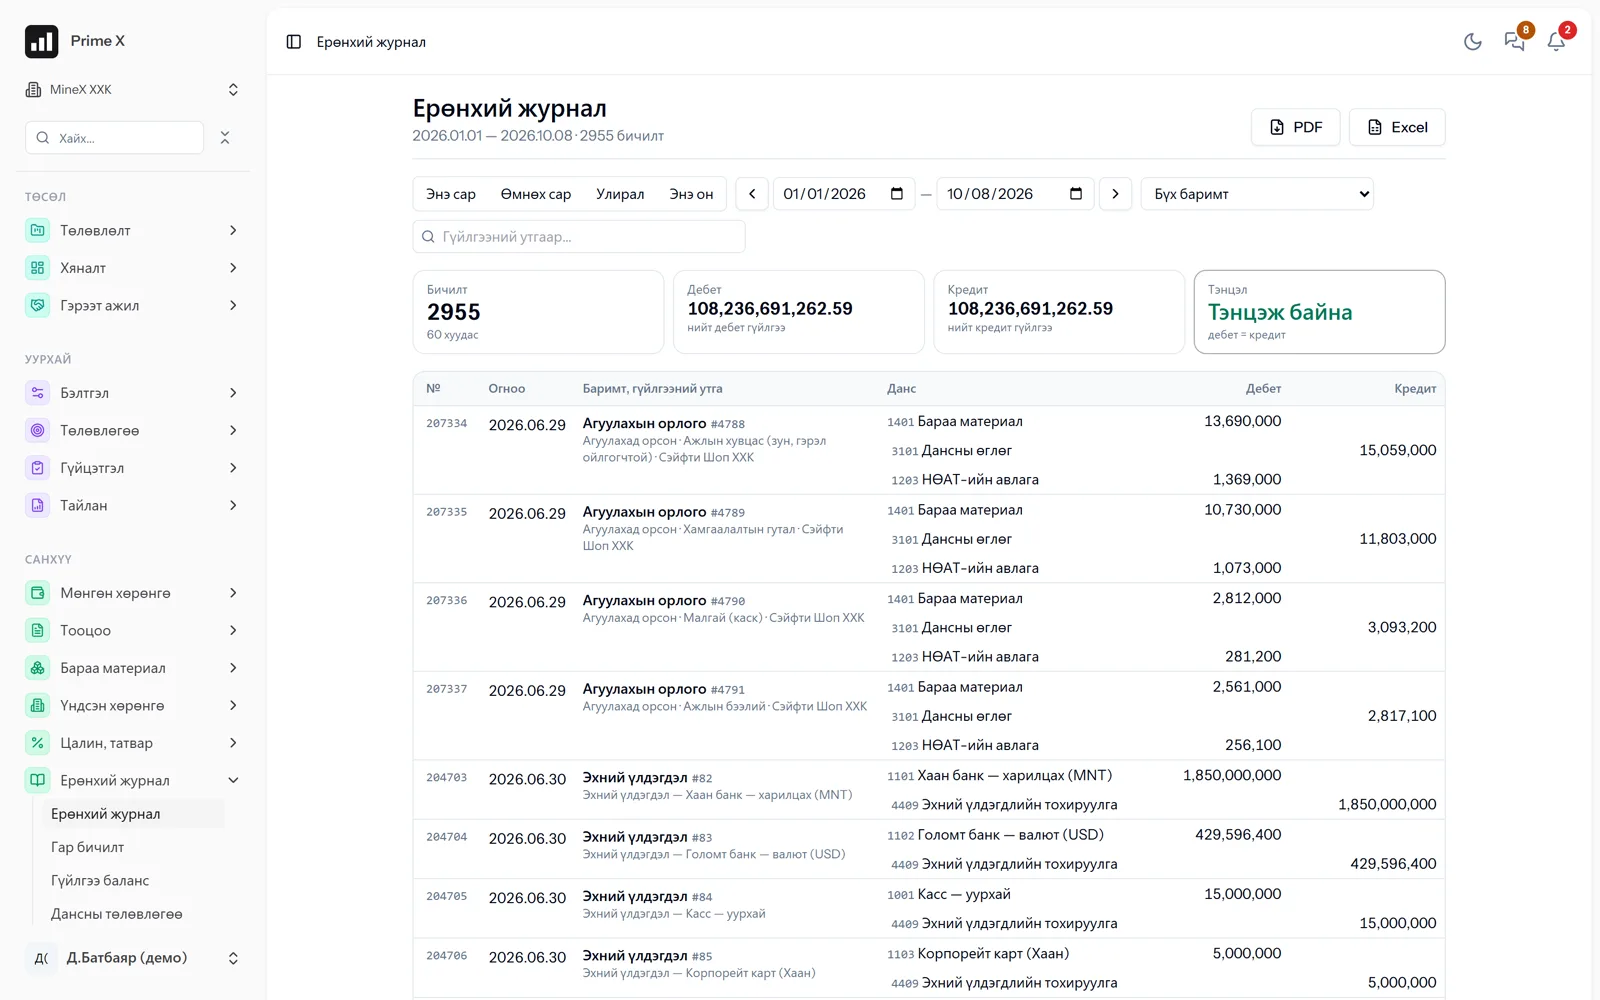
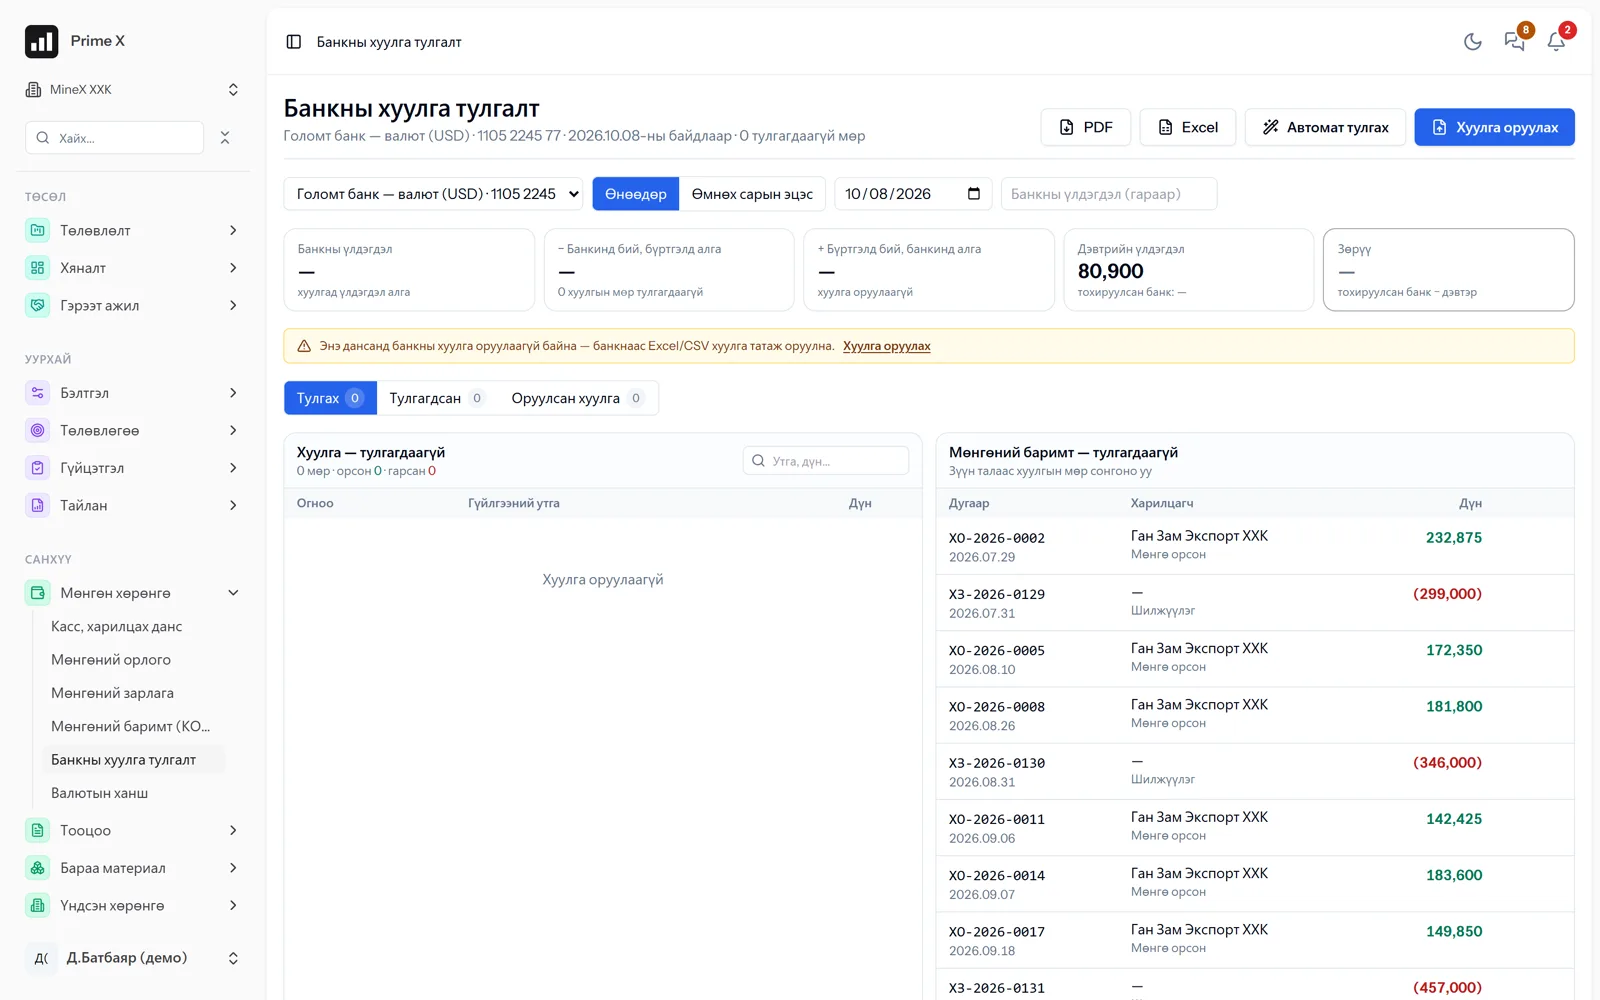
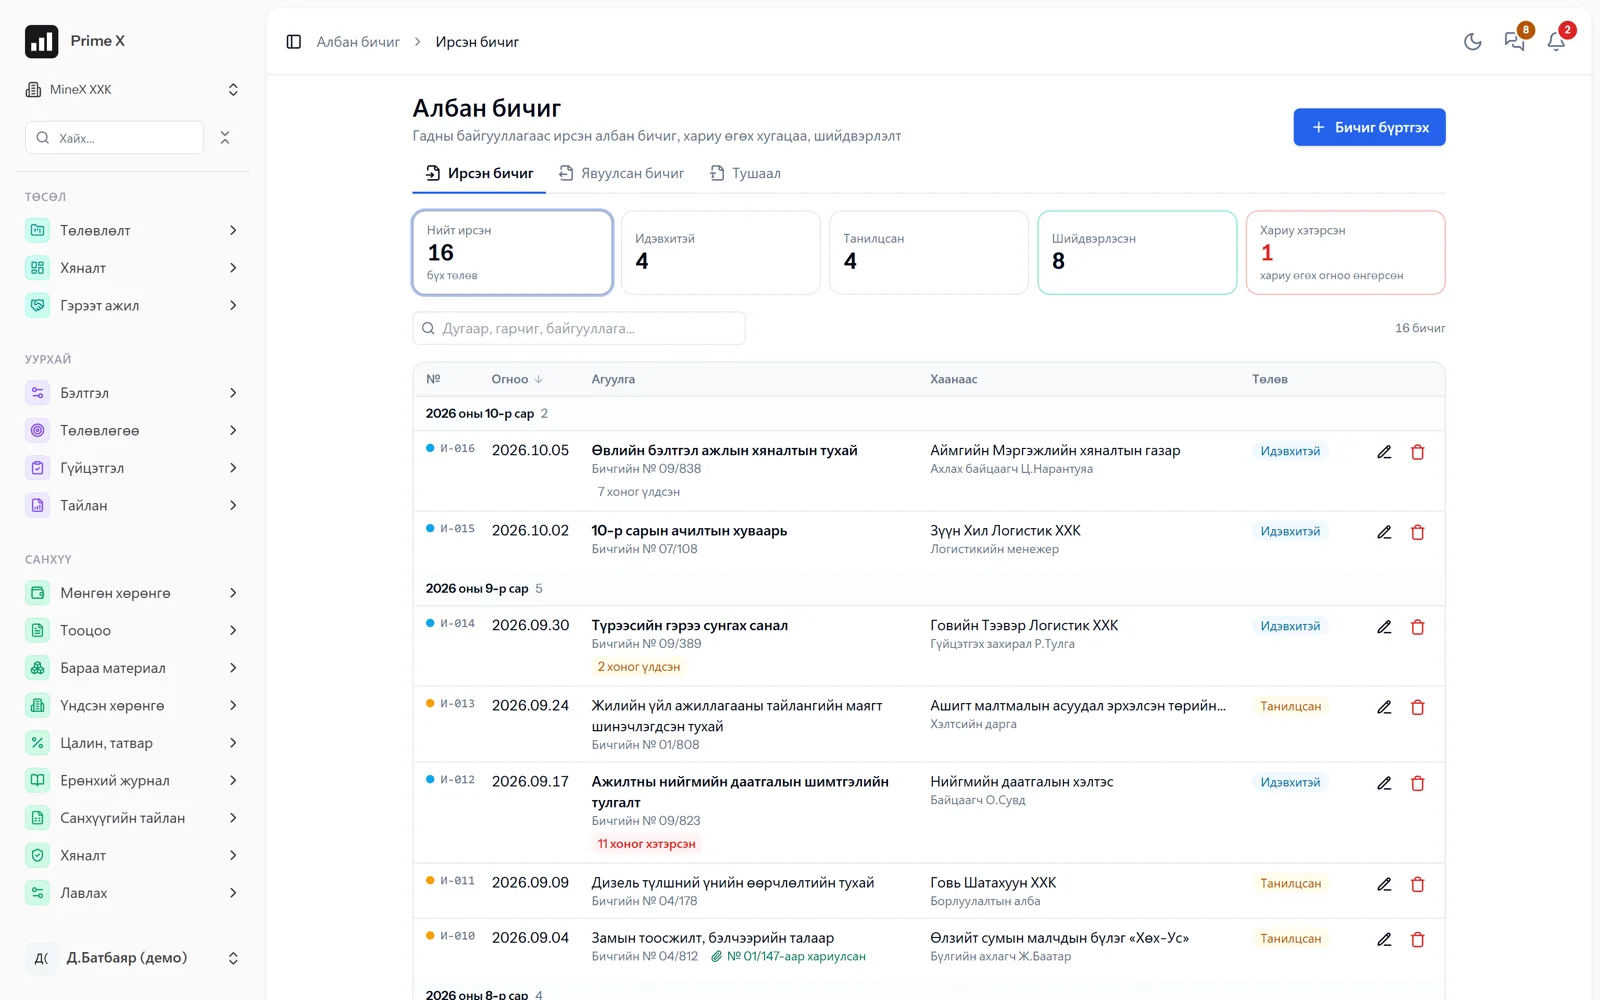
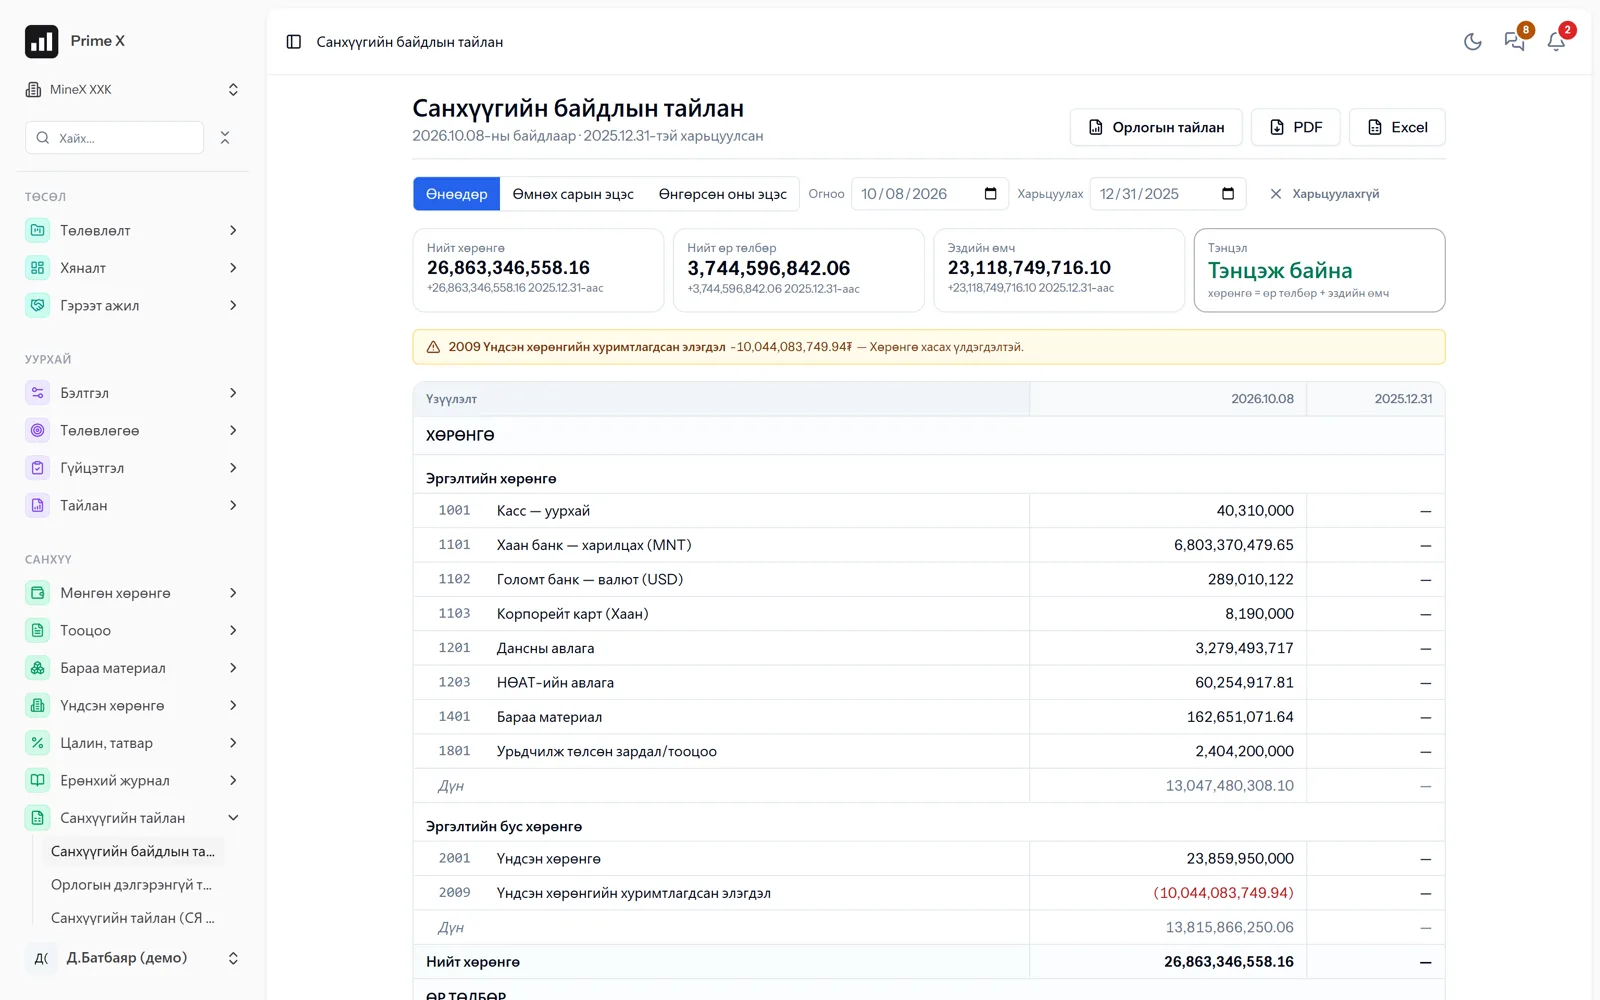
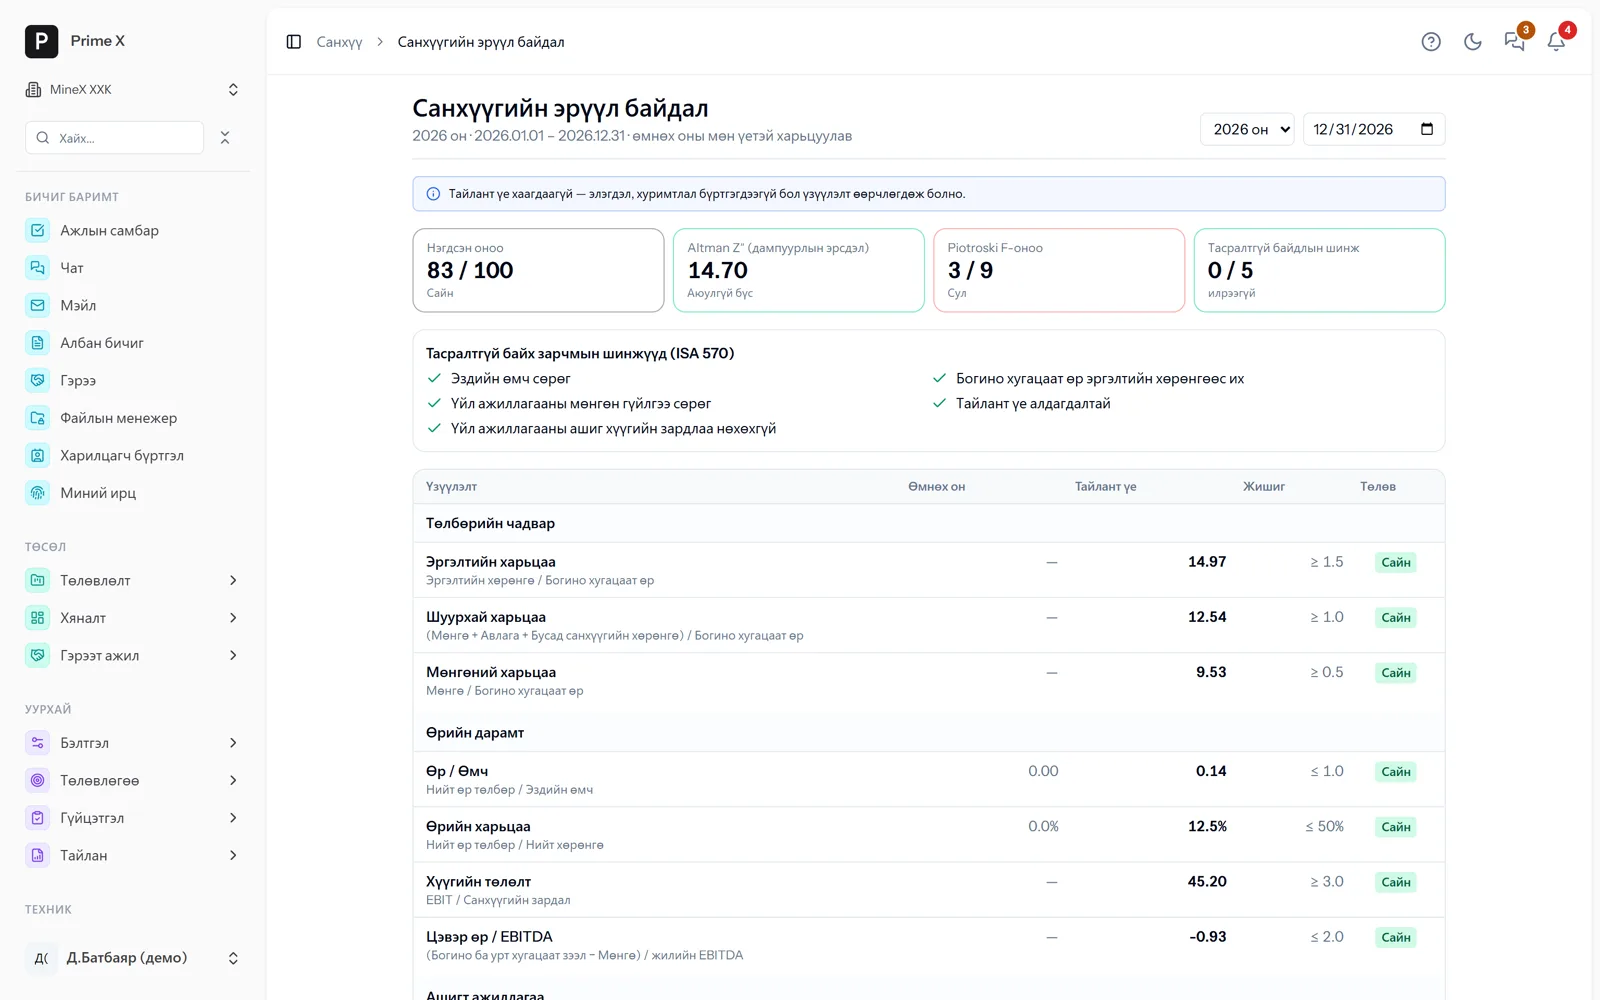
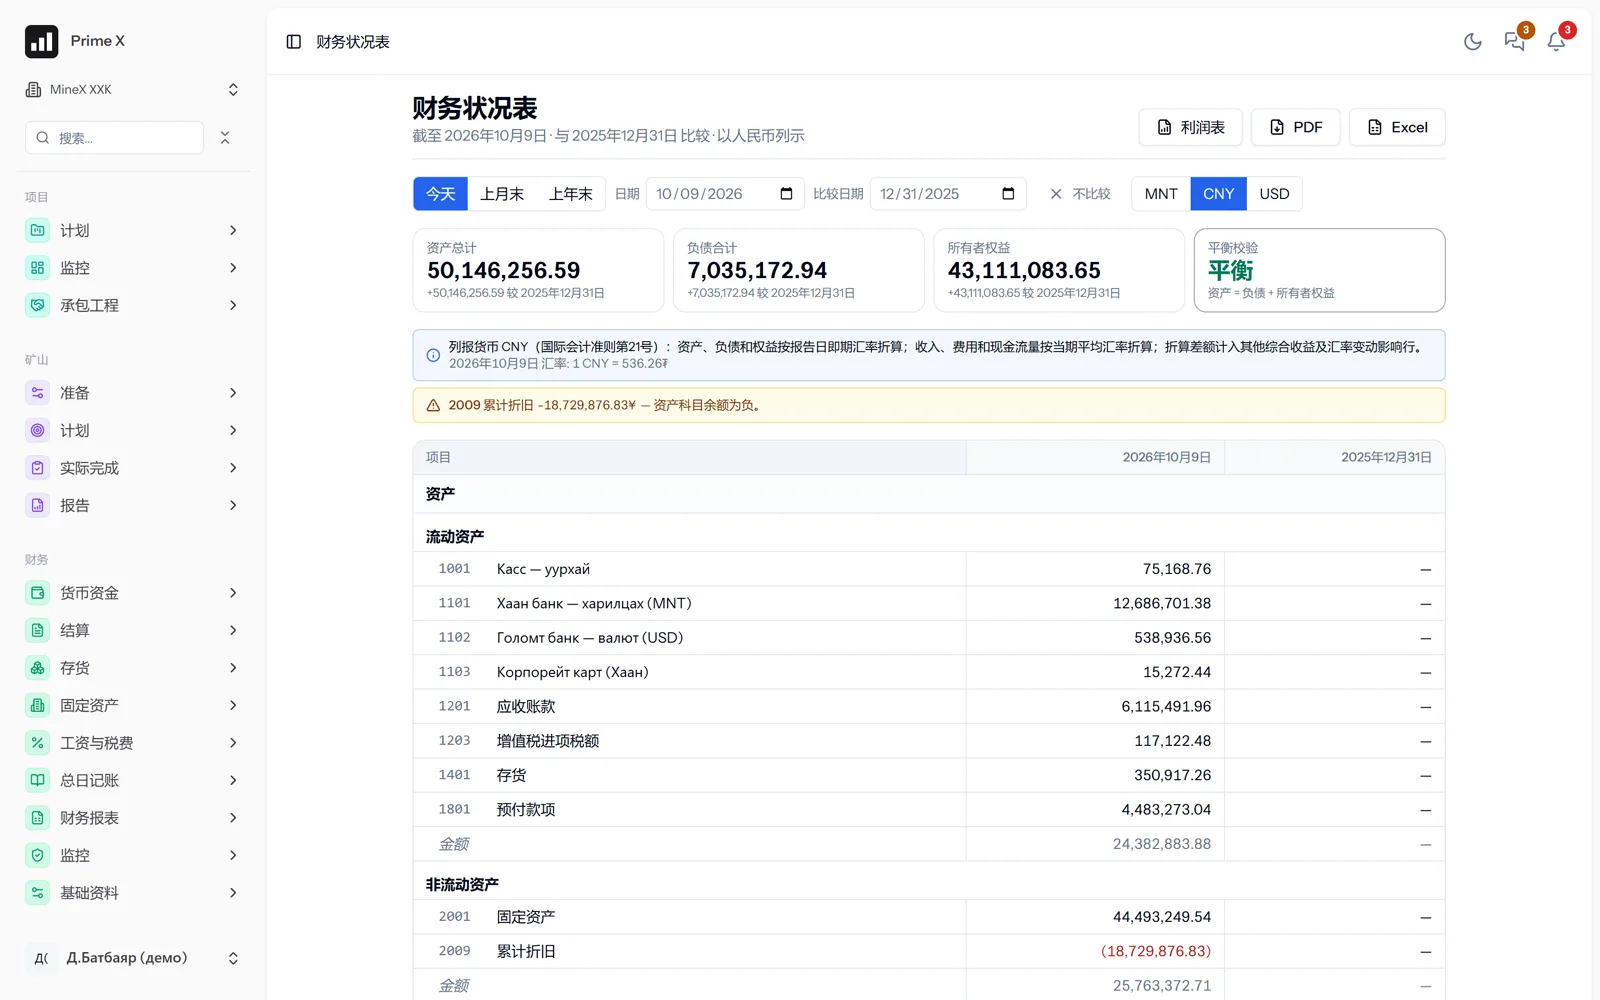
General ledger
2,955 entries
not manual — from operations
Act → Invoice → Ledger
Real demo company screen · sample data
-
01 Step 1 / 5
Loading at the pit
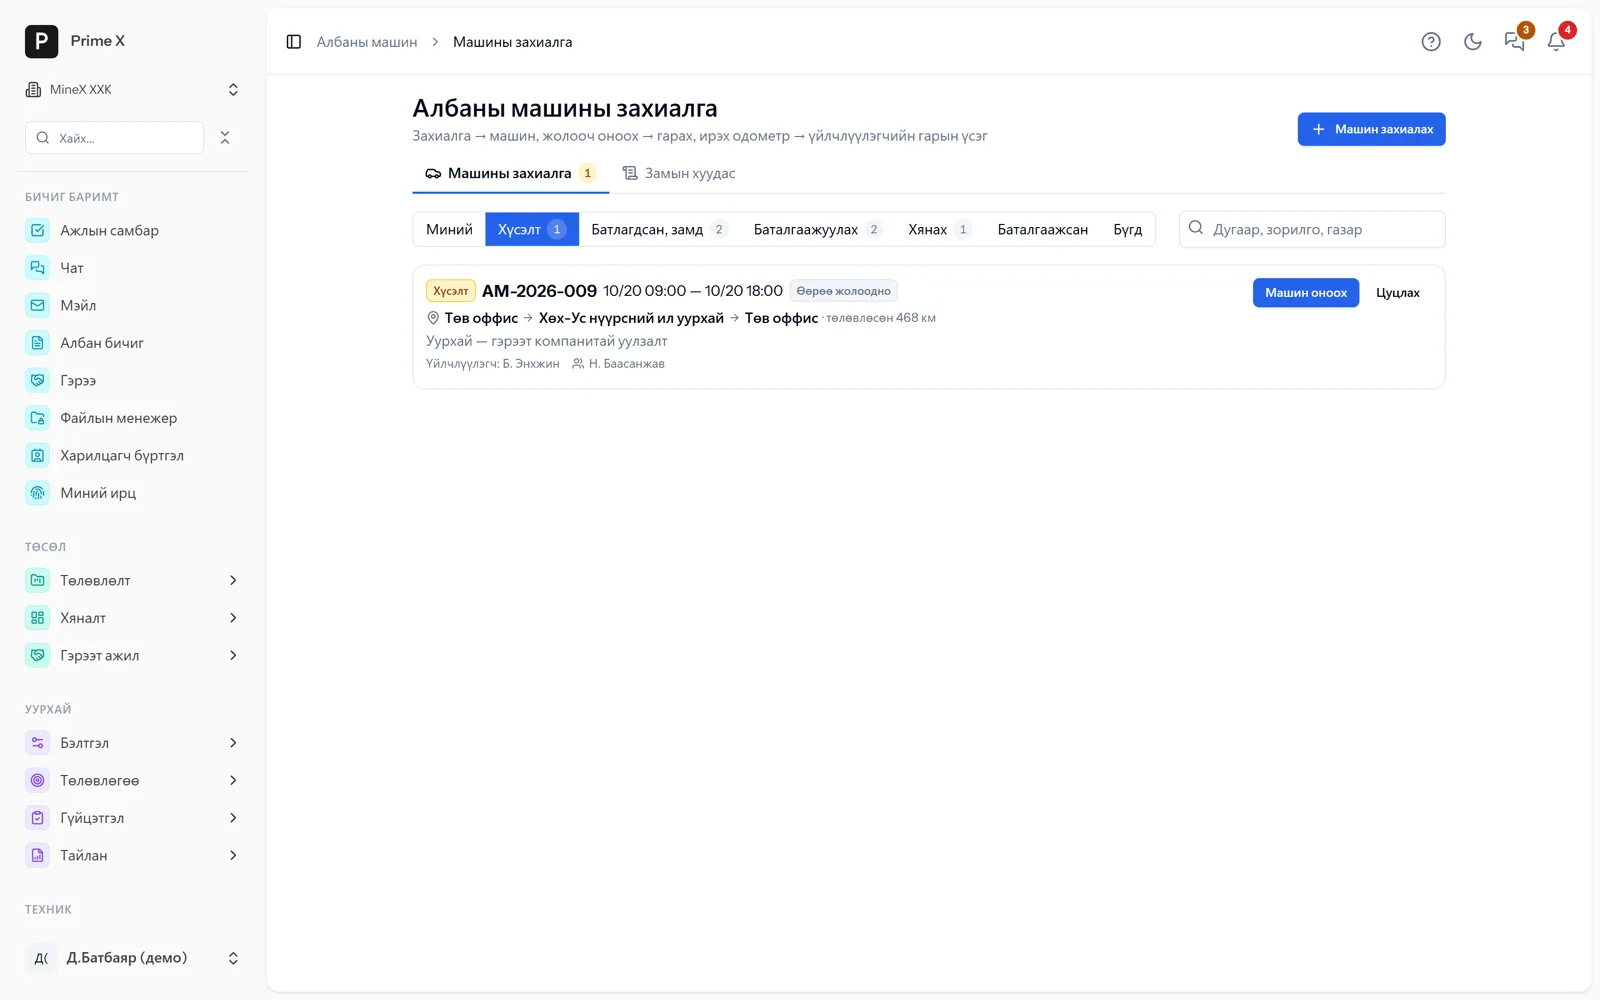
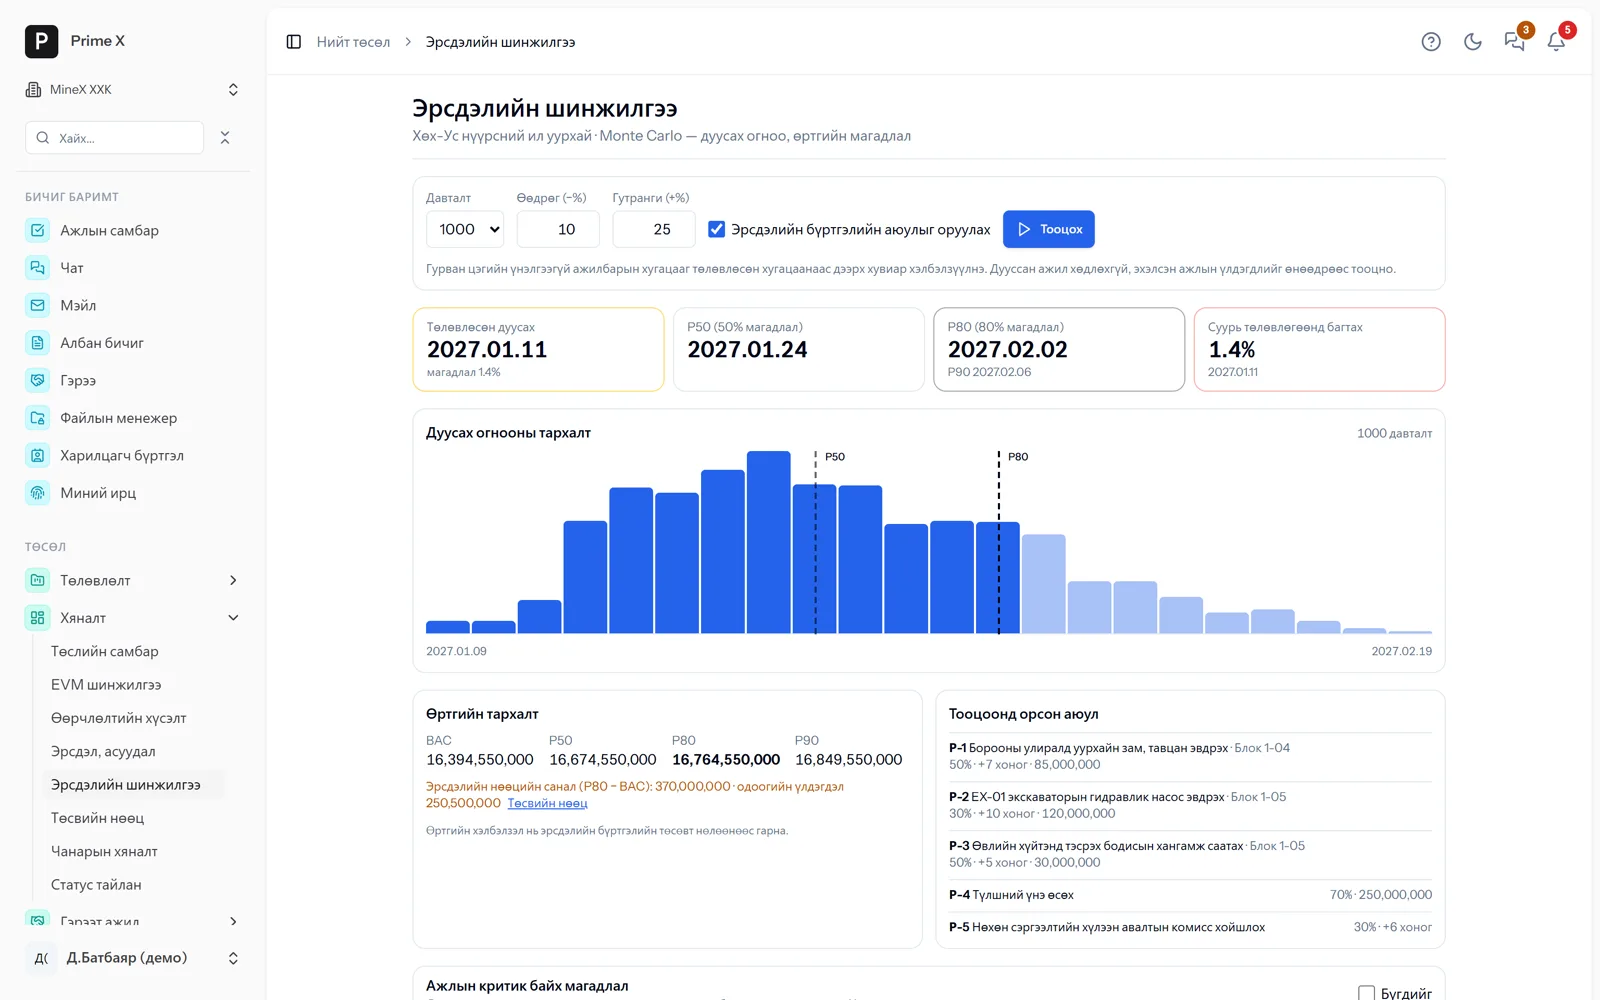
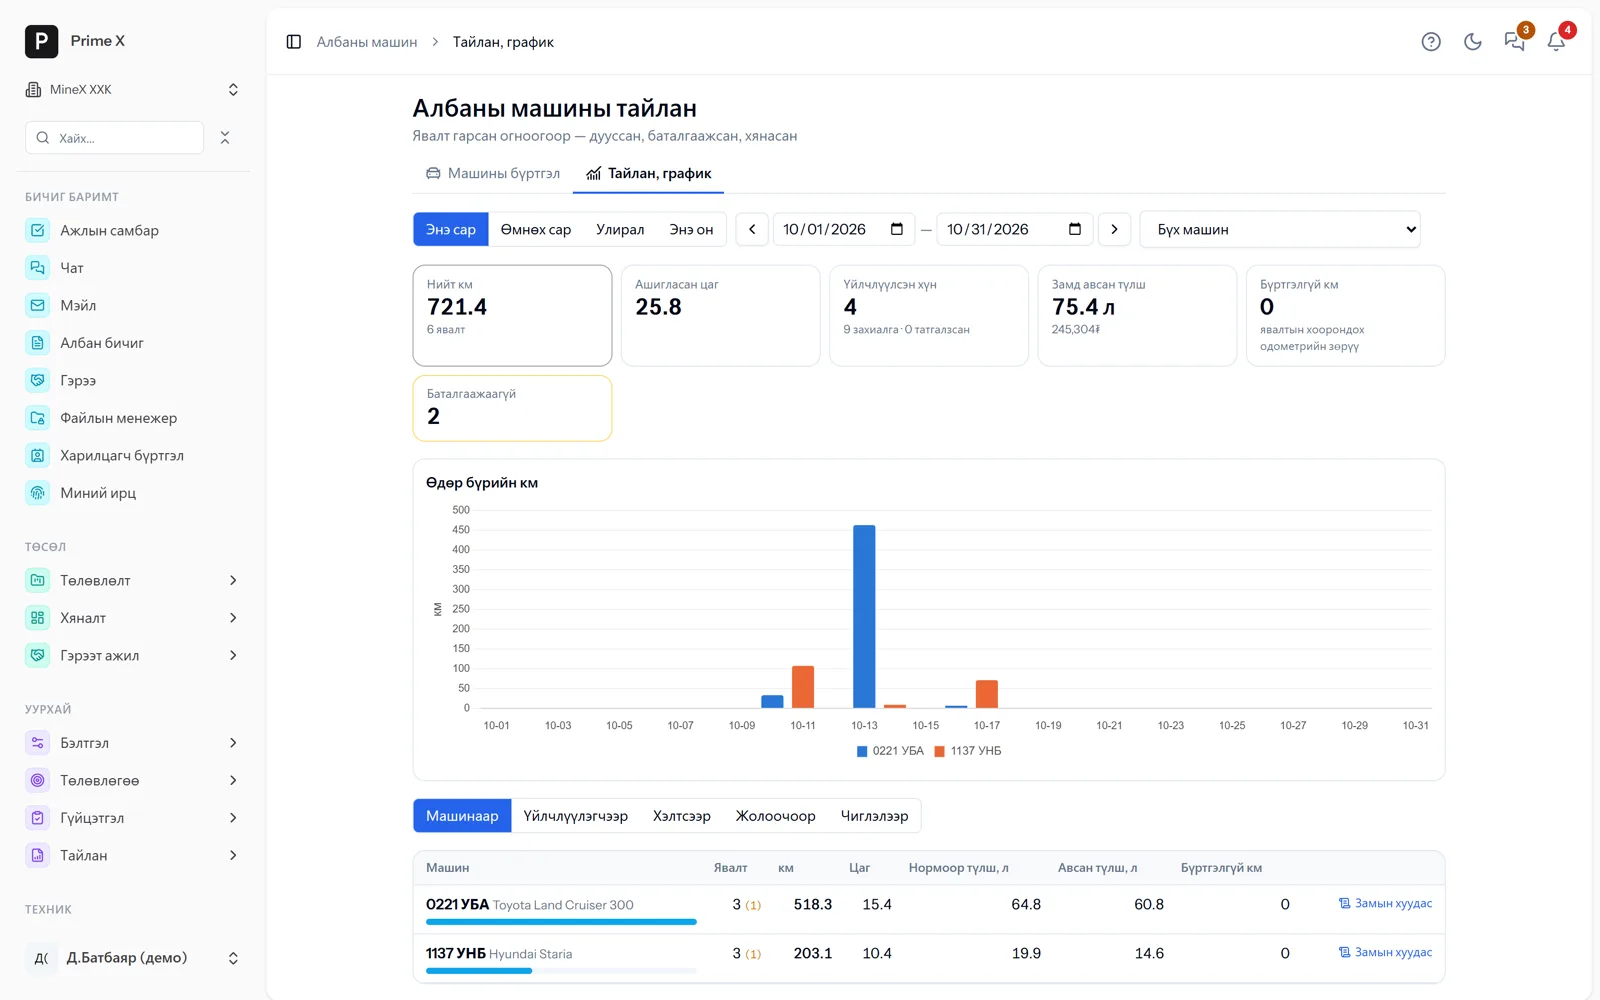
The excavator loads the truck. The driver writes nothing — the dispatcher drags each machine’s location and status on one table.
- Every time the excavator loads, the operator taps one button on the phone
- Truck, route and material match automatically
- No paper waybills, no Excel typing
- one load
- 55 t
- loading time
- 2:40
- haul distance
- 1.8 km
Next → The trip is recorded in the dispatcher
-
02 Step 2 / 5
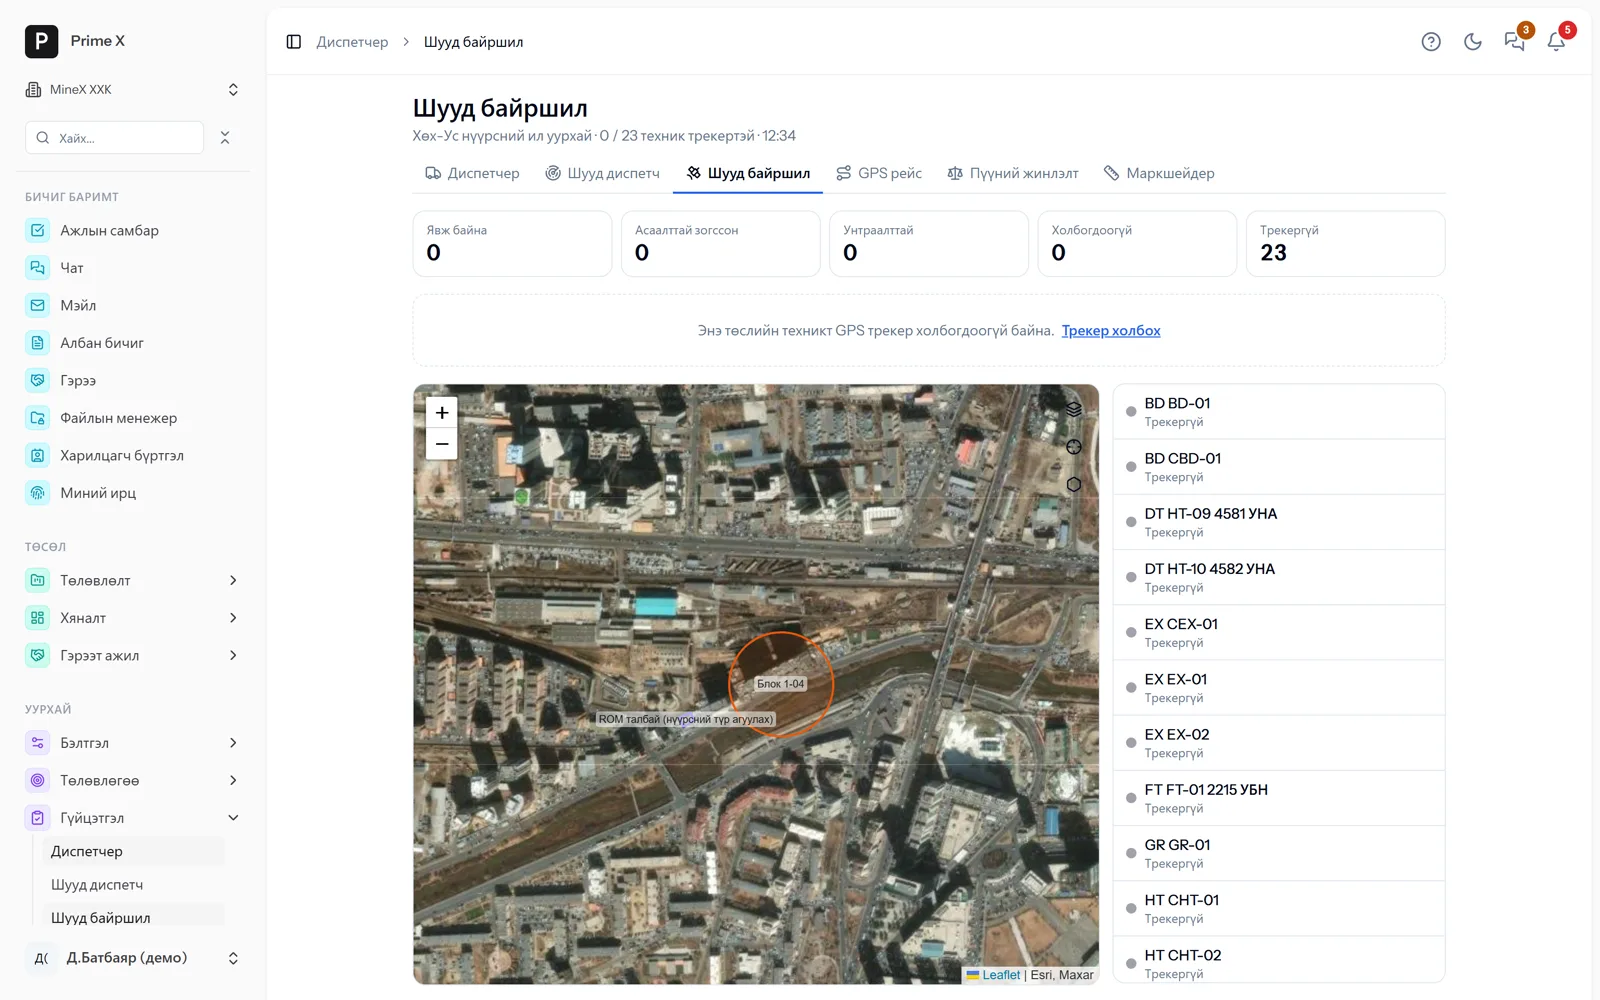
The trip is recorded in the dispatcher
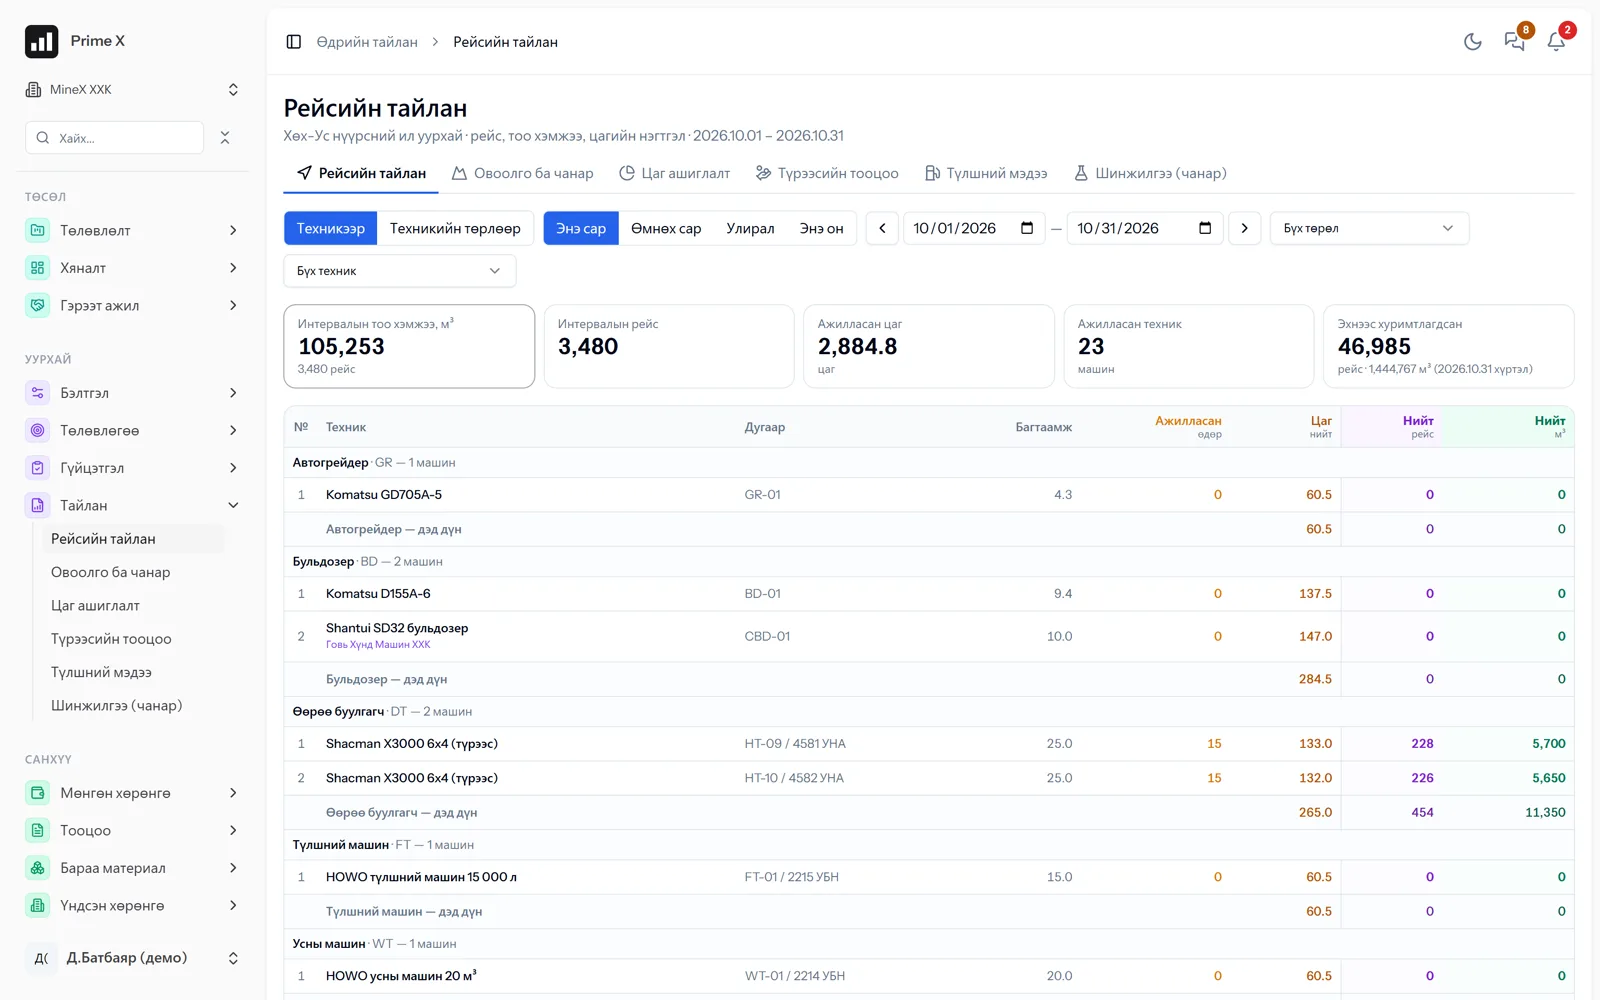
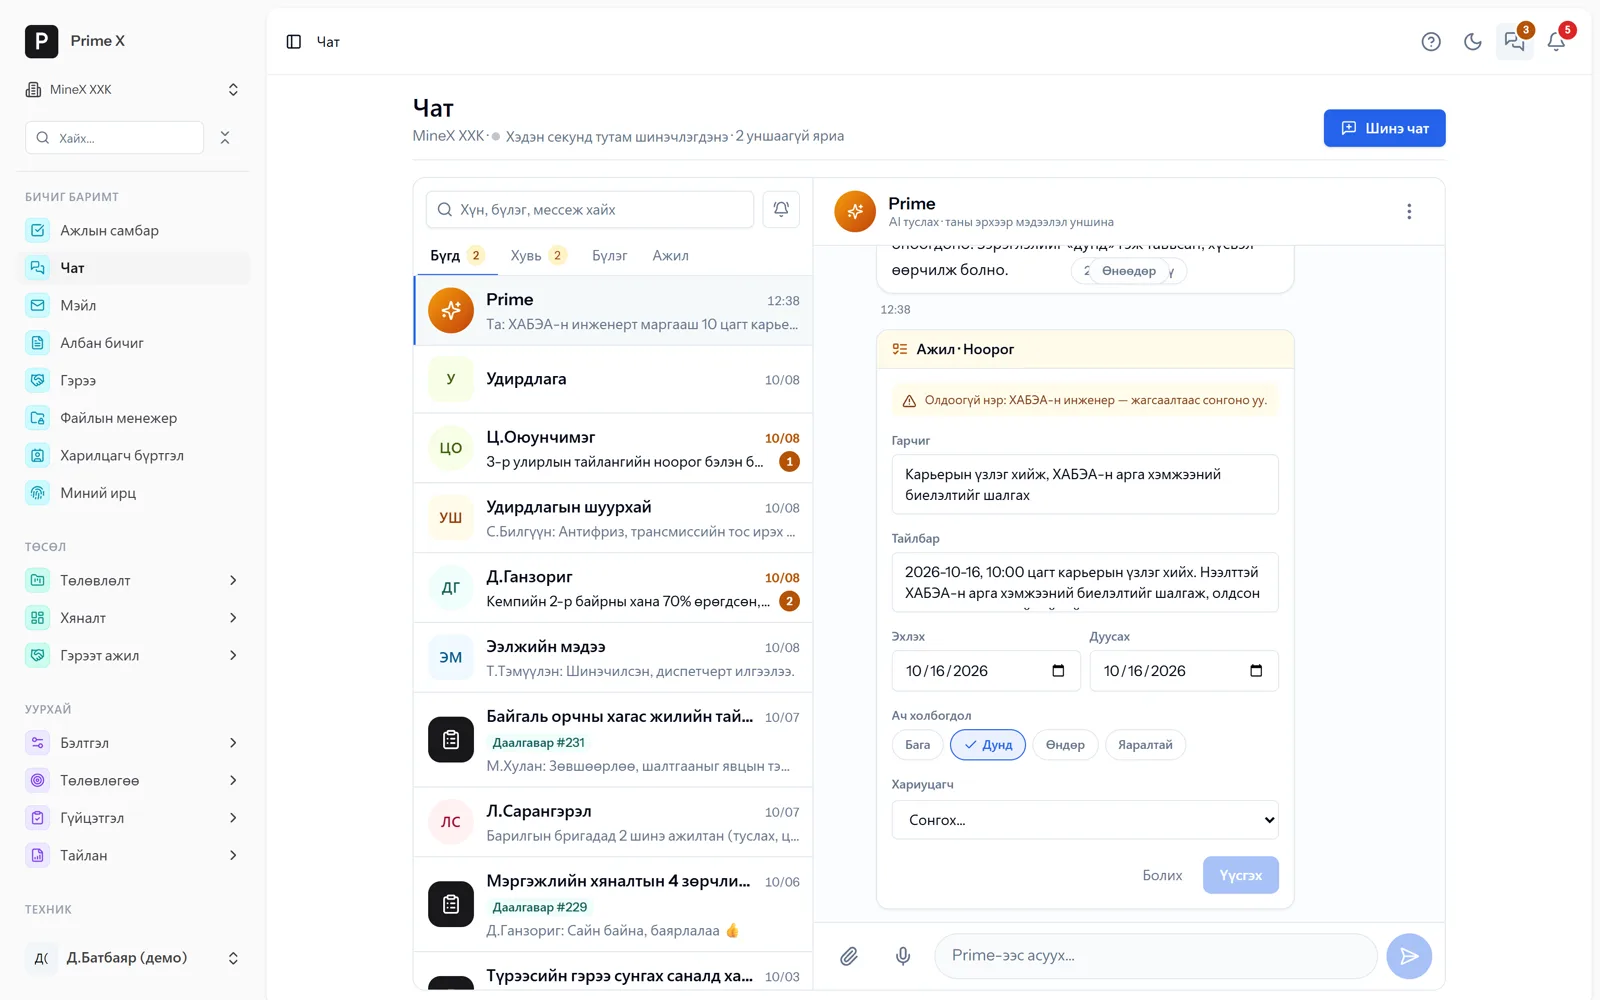
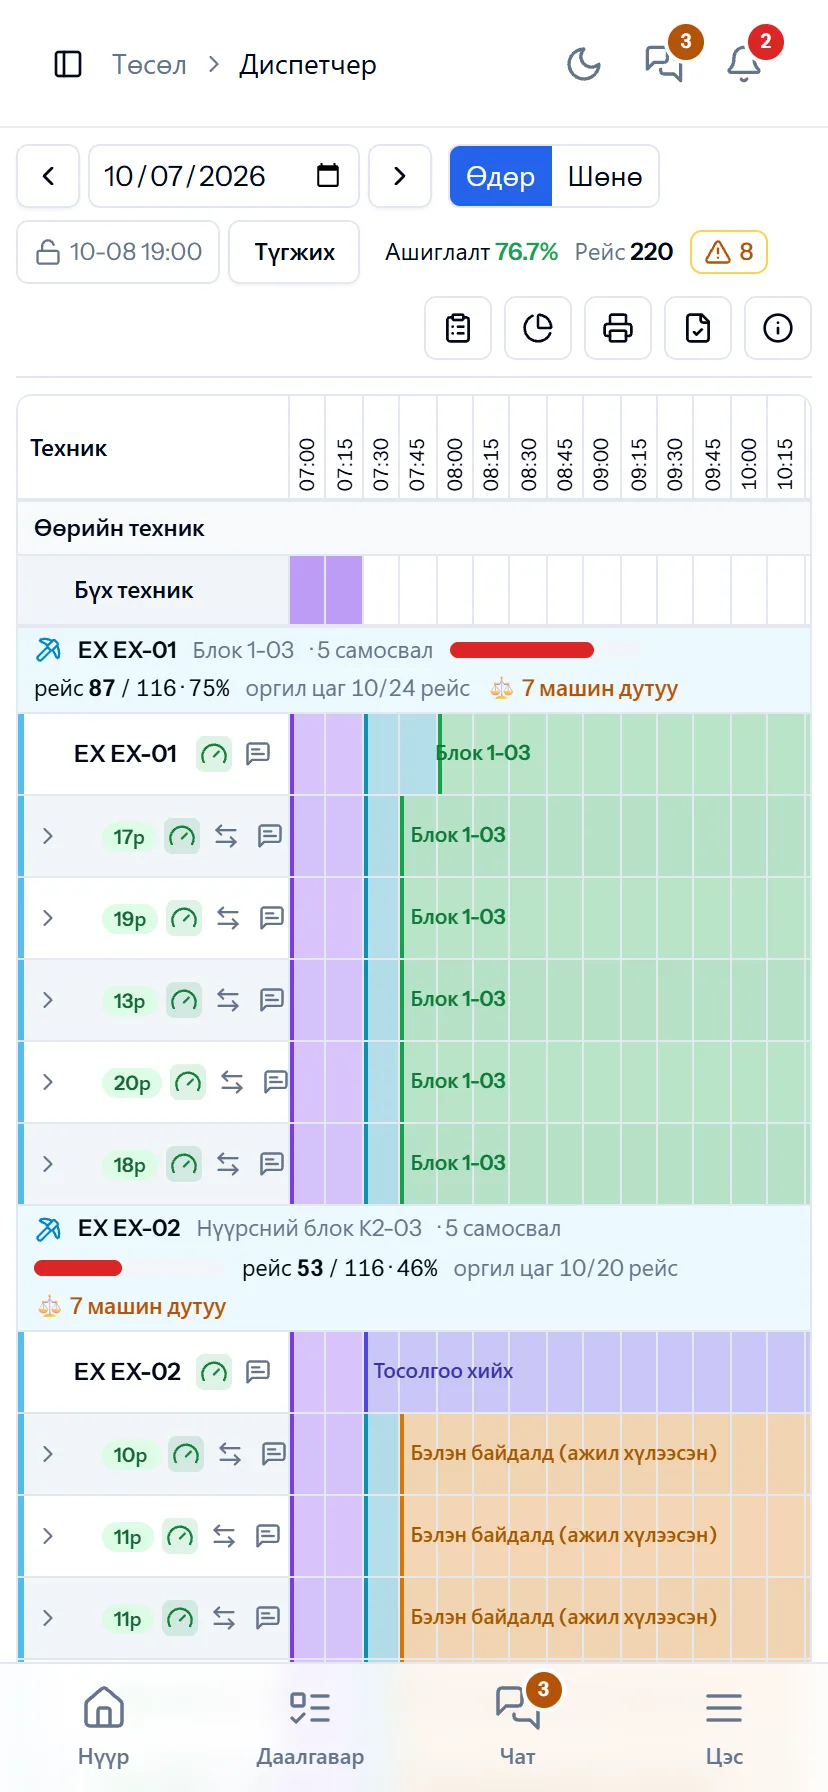
Machine, route, material, time — every trip is recorded on the dispatcher board instantly. The same table from the field on a phone. No paper waybills, no Excel typing.
- The trip is recorded on the dispatcher board instantly
- Exactly the same table from the field on a phone
- Machine, driver, time — all in one record
- trips per shift
- 220
- utilisation
- 76.7%
- alerts
- 8
Next → The dispatcher timeline is drawn
-
03 Step 3 / 5
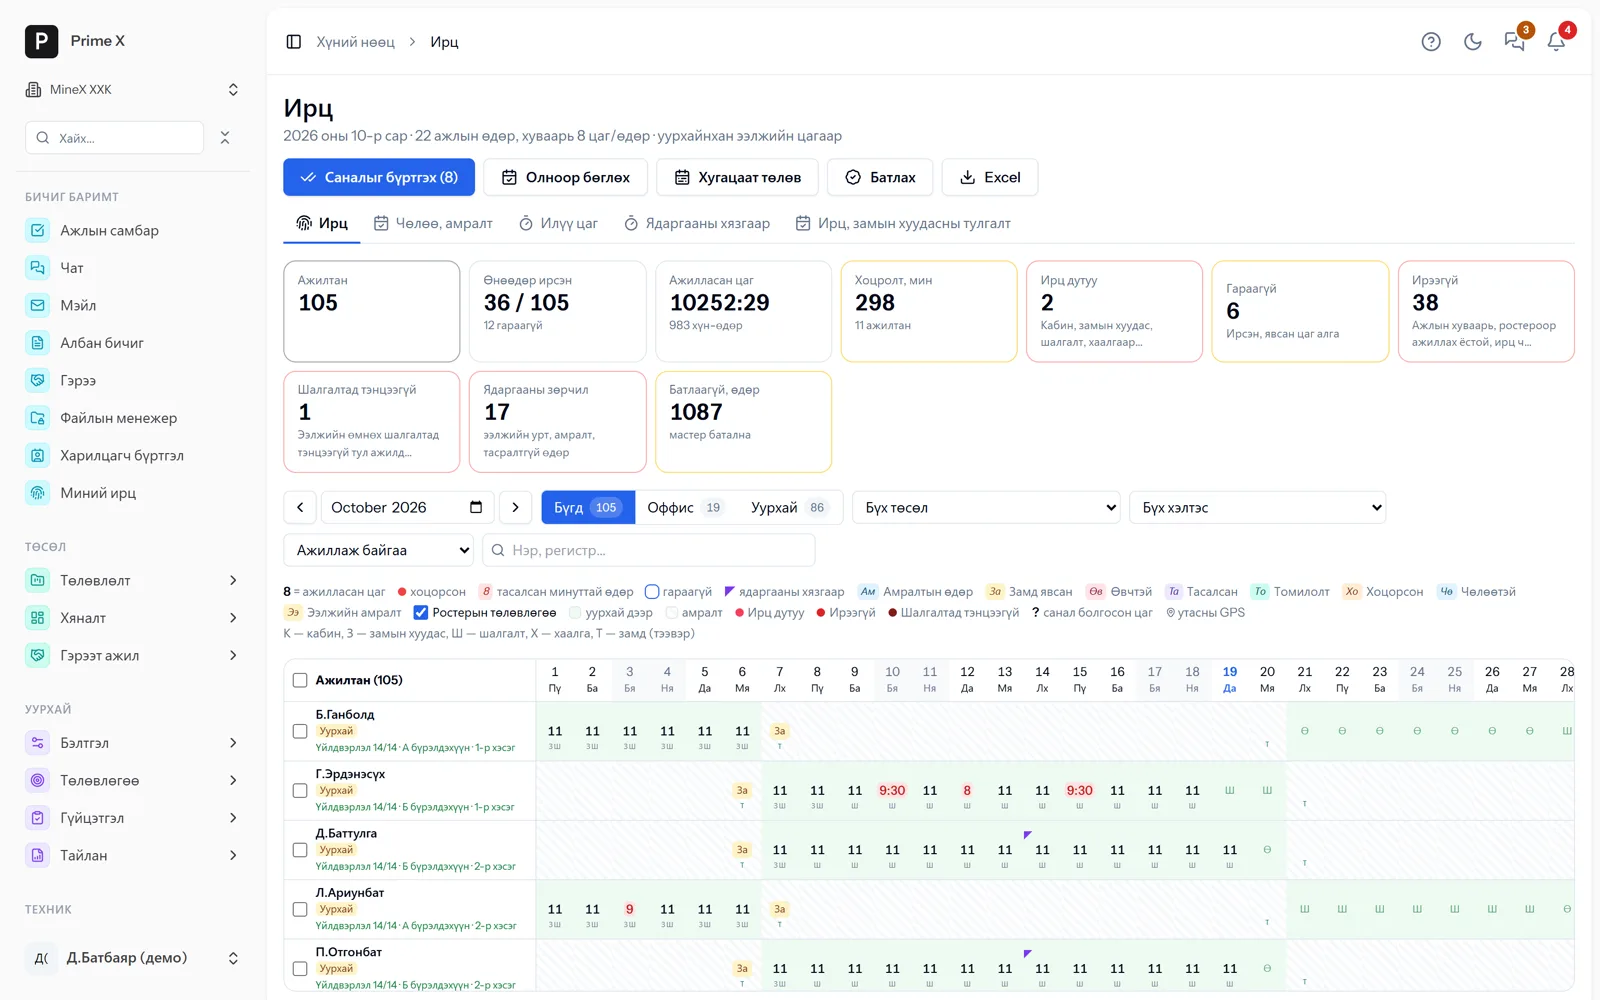
The dispatcher timeline is drawn
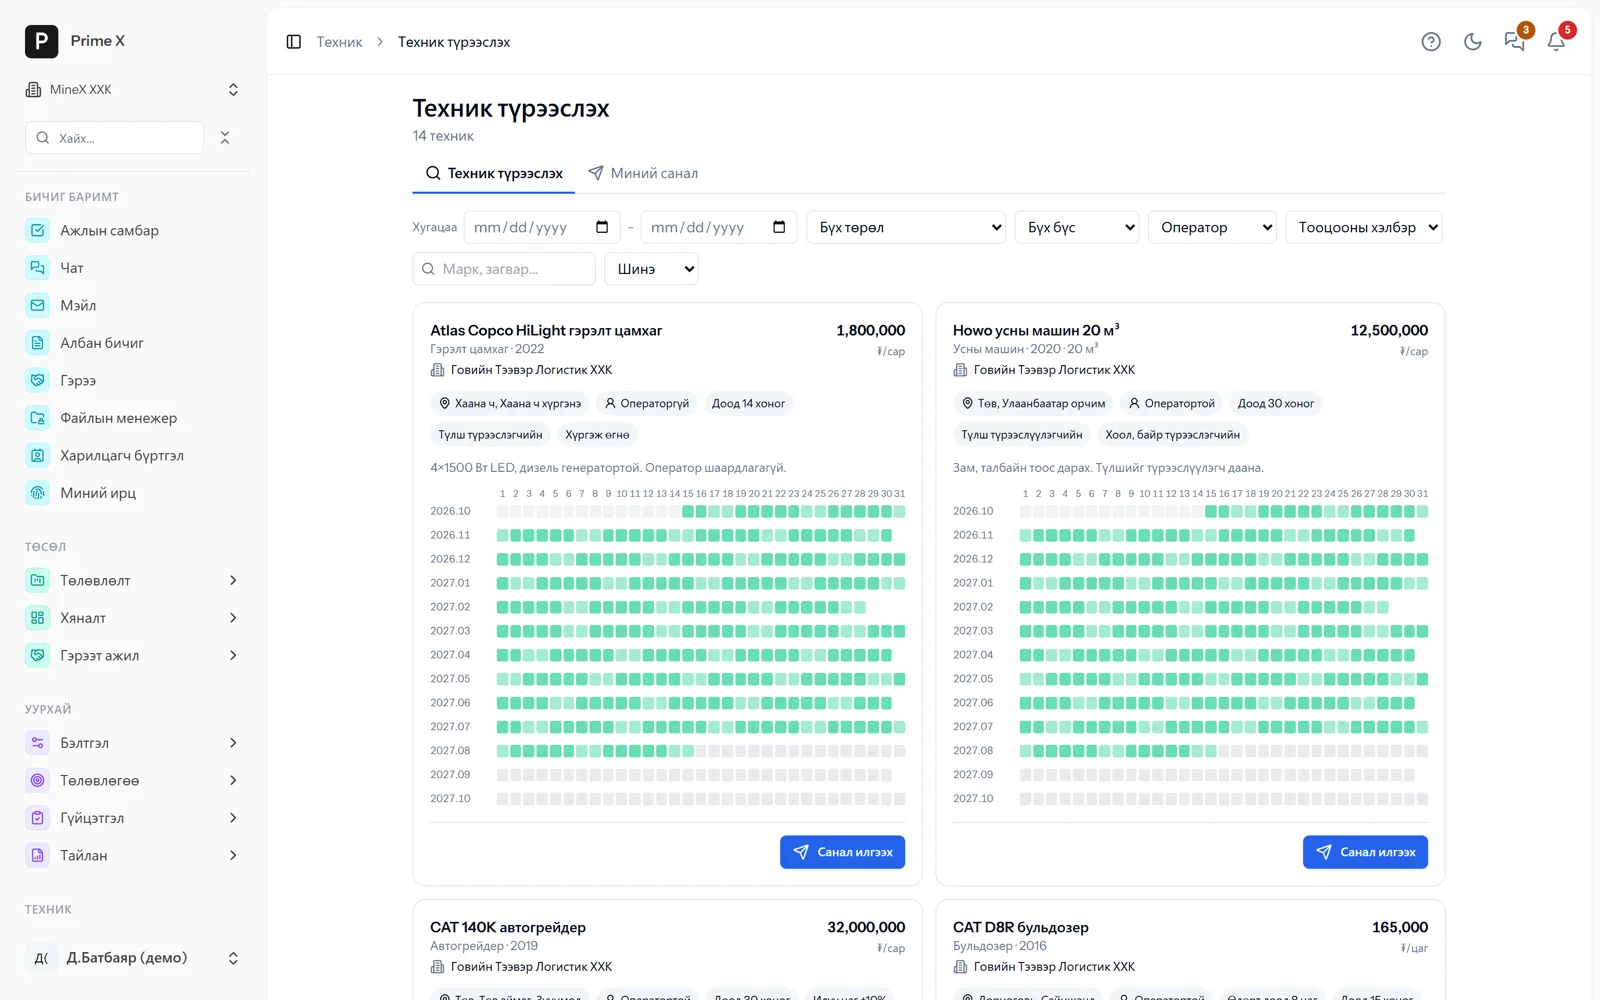
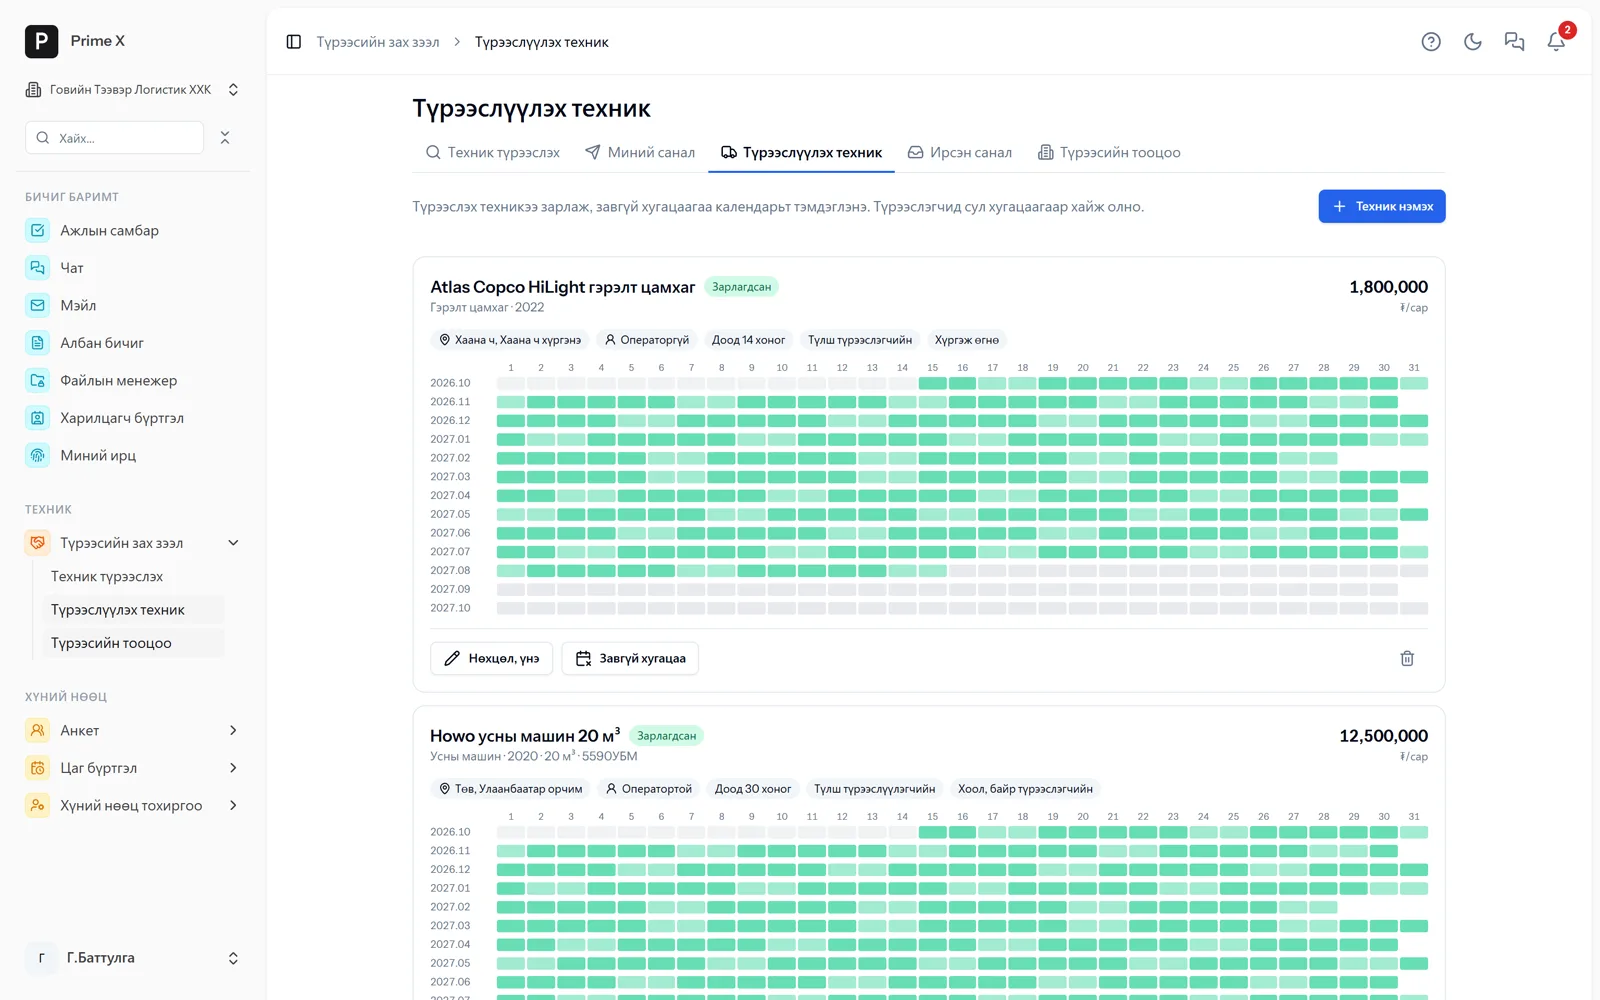
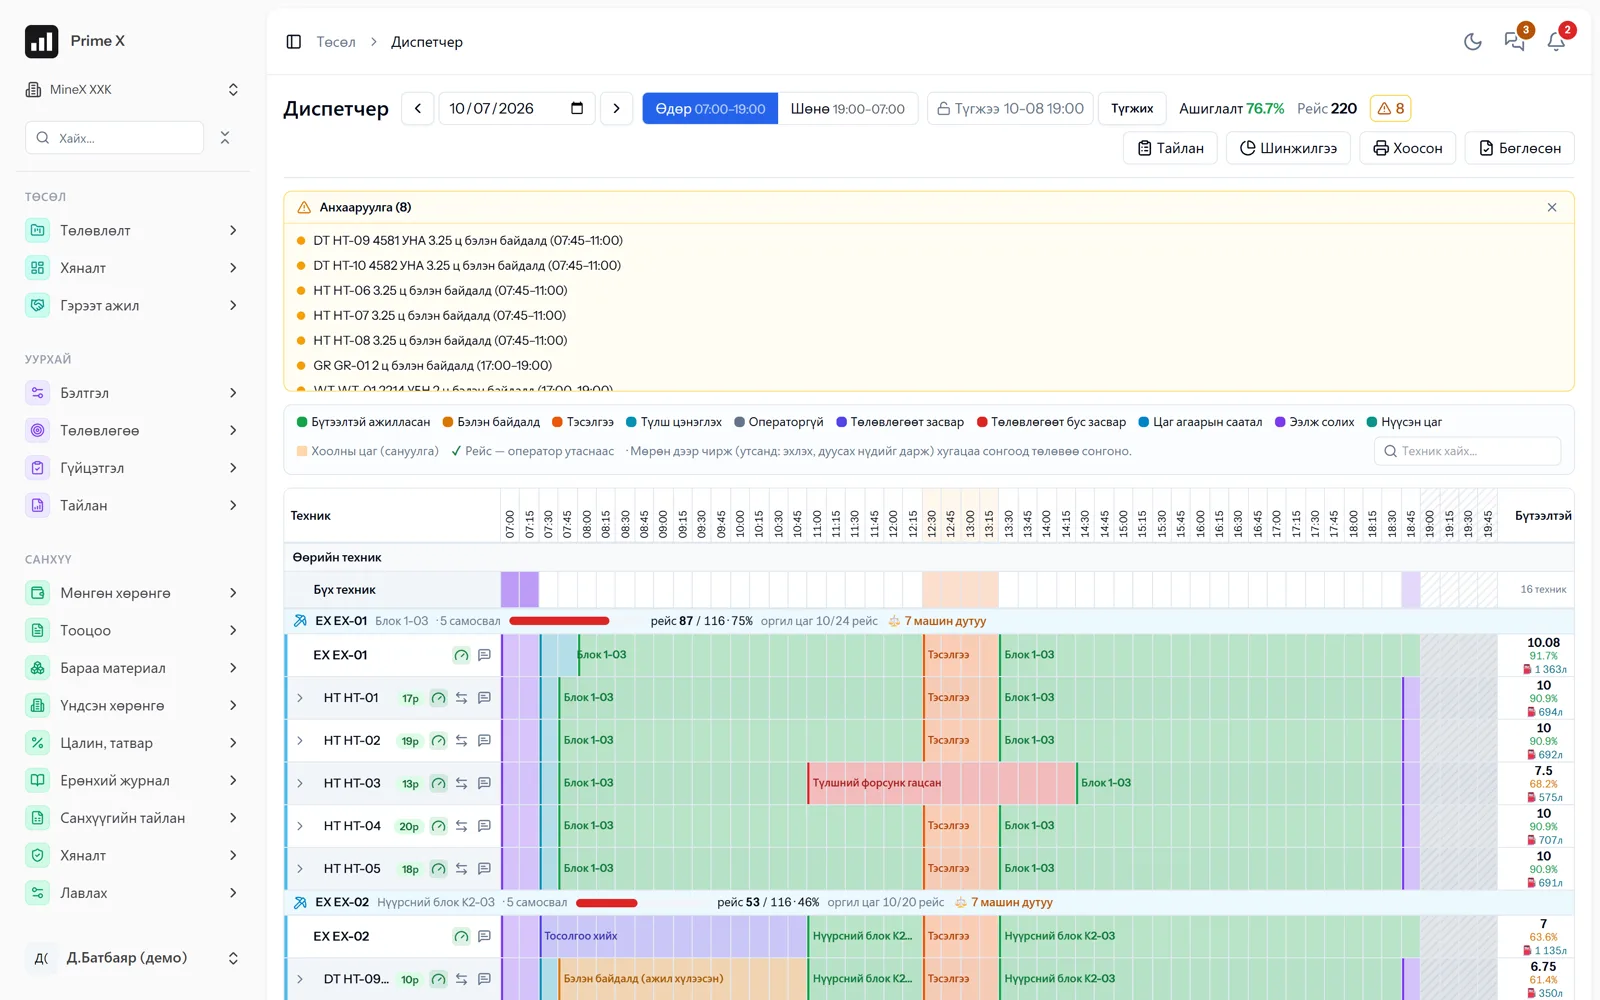
Every machine’s work, standby and repair are drawn in colour on the shift timeline. Utilisation, trips and alerts in real time.
- Every machine’s status in colour on the timeline
- Alerts for machines standing too long on standby
- Engine hours, fuel and productive hours automatically
- resolution
- 15 min
- status in colour
- 11
- standby reminder
- 2 h+
Next → The work schedule fills with performance
-
04 Step 4 / 5
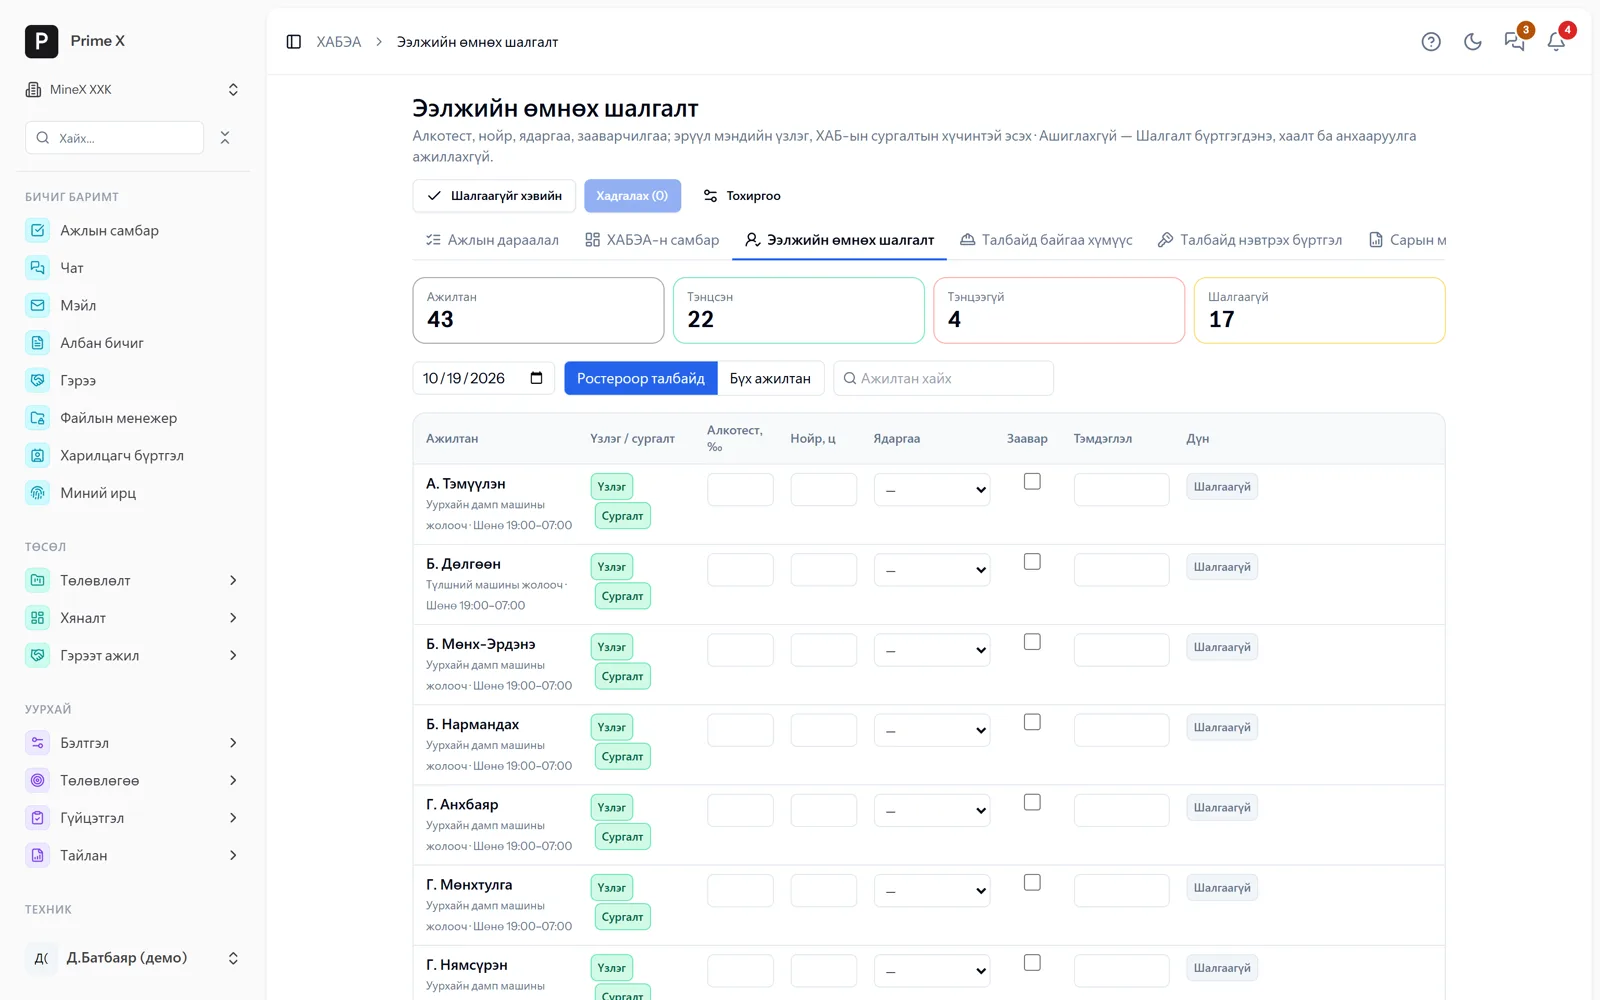
The work schedule fills with performance
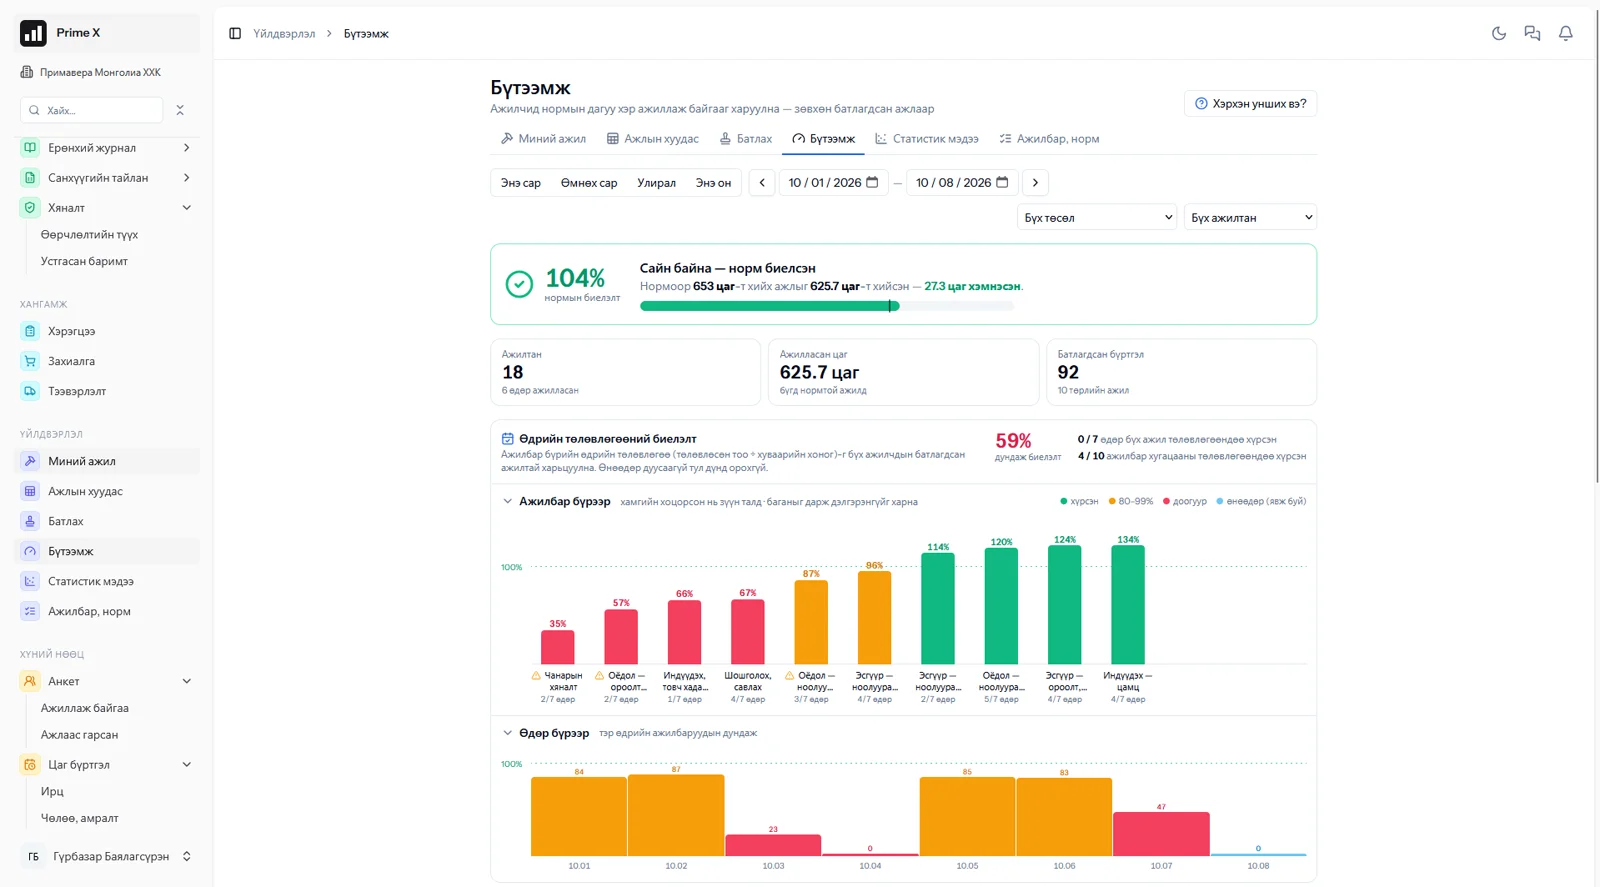
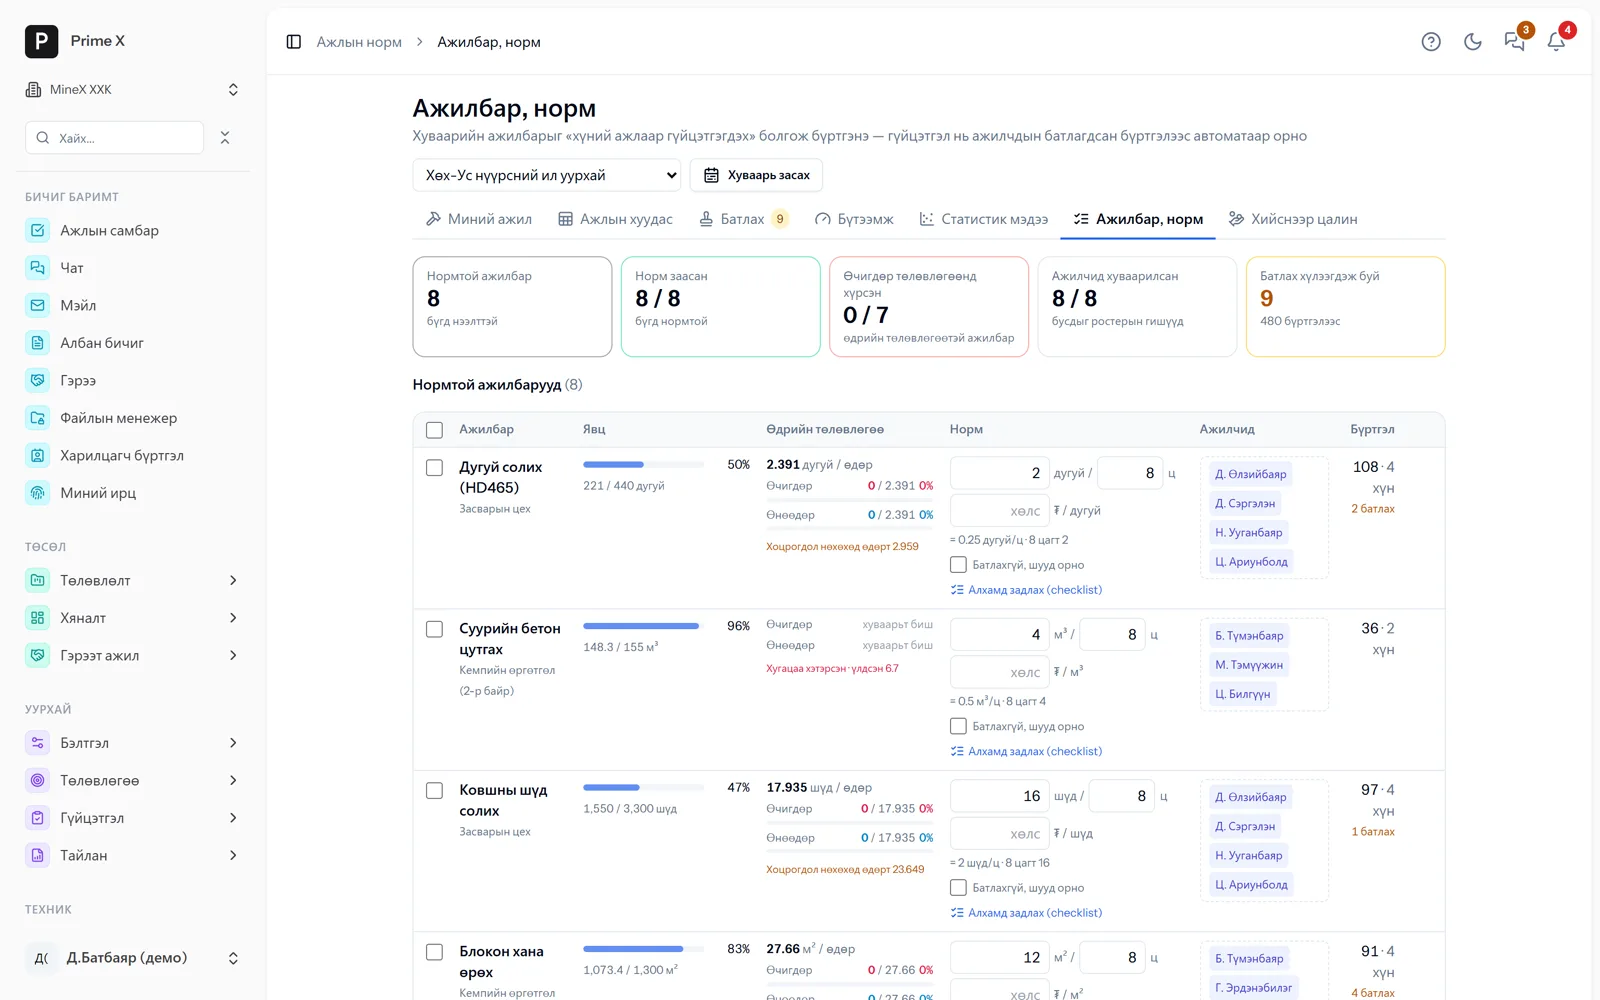
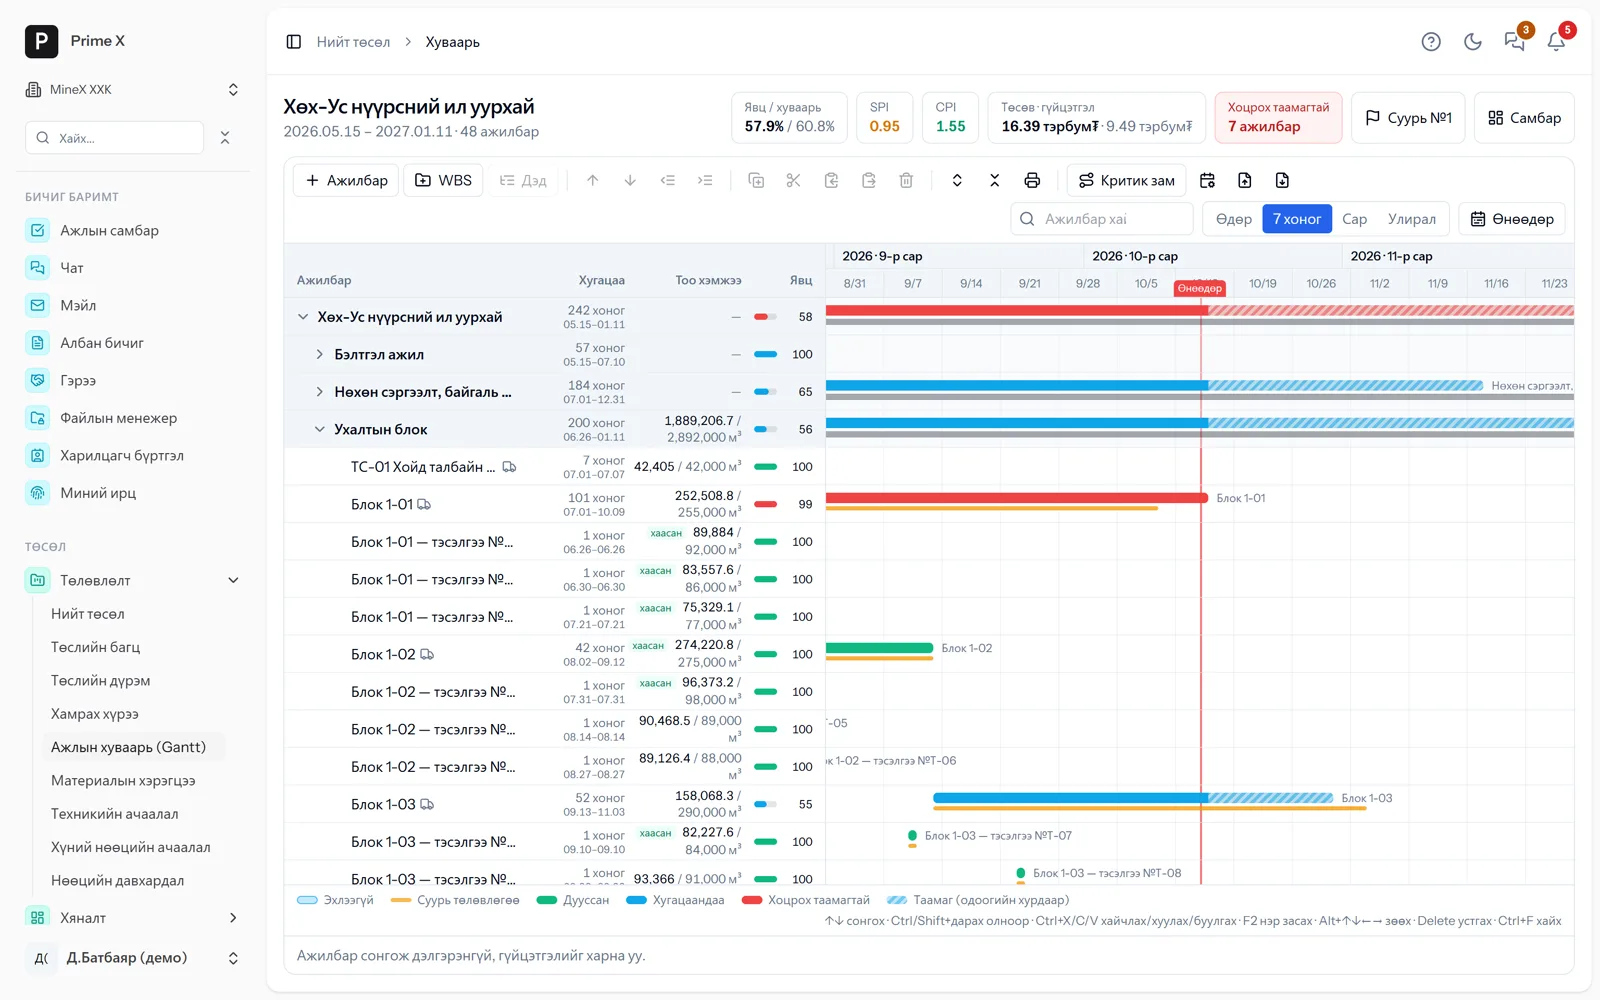
Trip counts become block and activity performance, and the project schedule shows plan and actual side by side. The system itself predicts which activities will slip.
- Trips become block performance and go into the schedule
- Plan (grey) and actual (blue) side by side
- The system itself predicts which activities will slip
- performance
- 57.9%
- schedule performance
- SPI 1.01
- predicted to slip
- 6
Next → Dashboard, acts and ledger are created automatically
-
05 Step 5 / 5
Dashboard, acts and ledger are created automatically
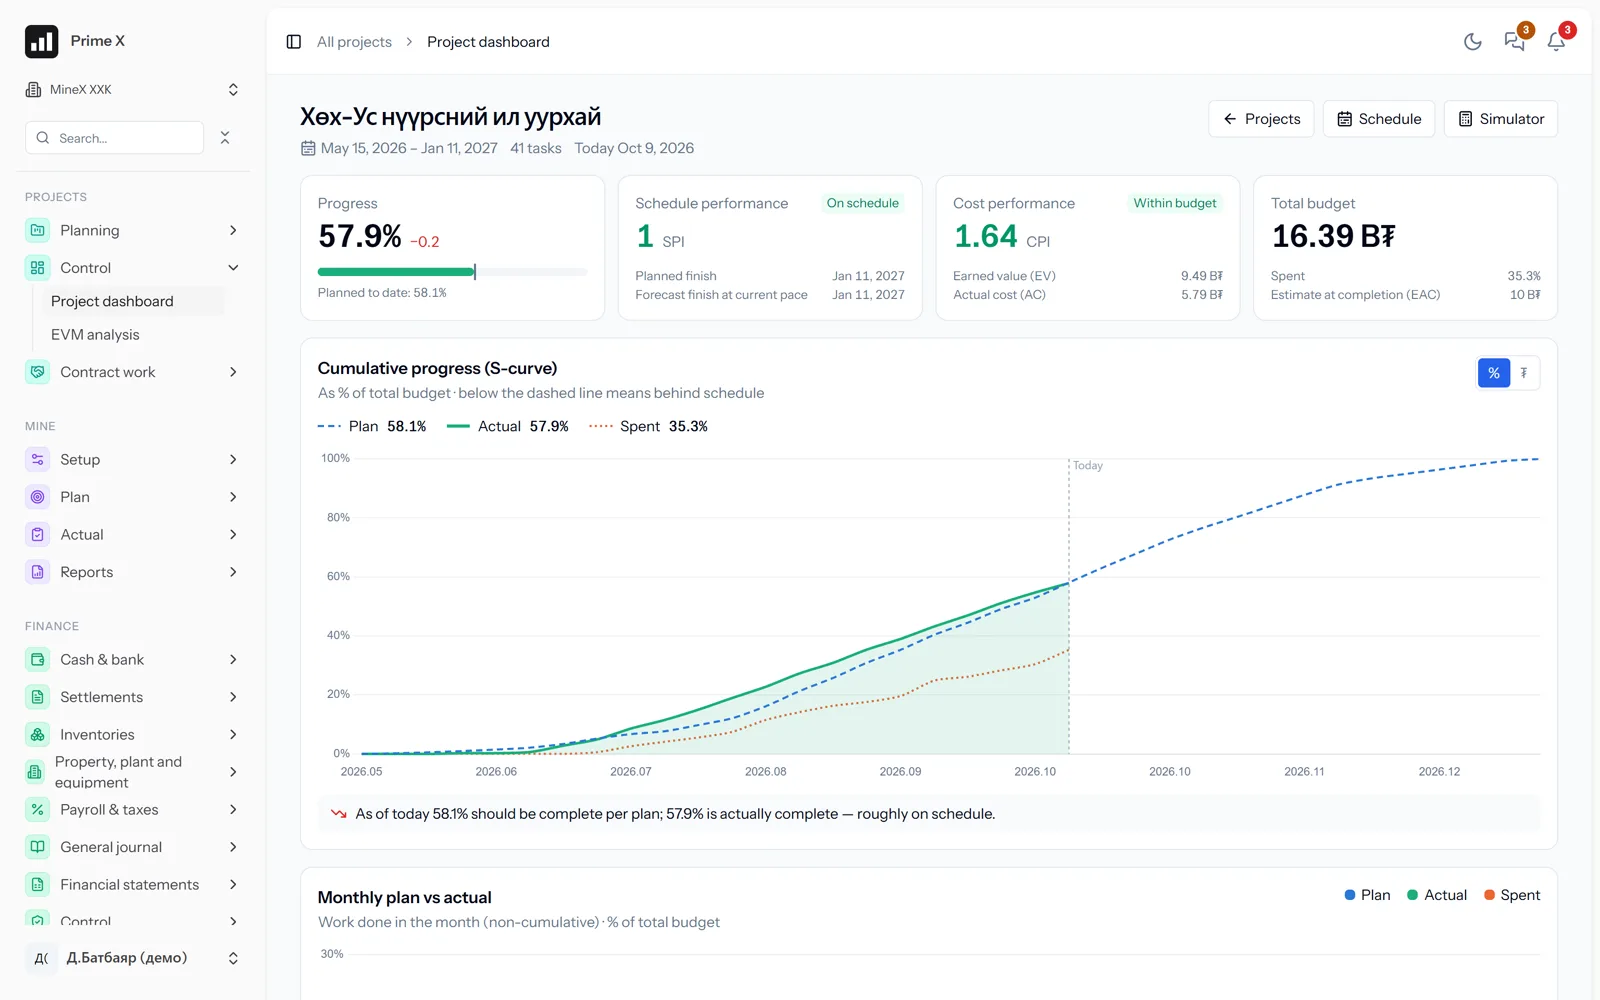
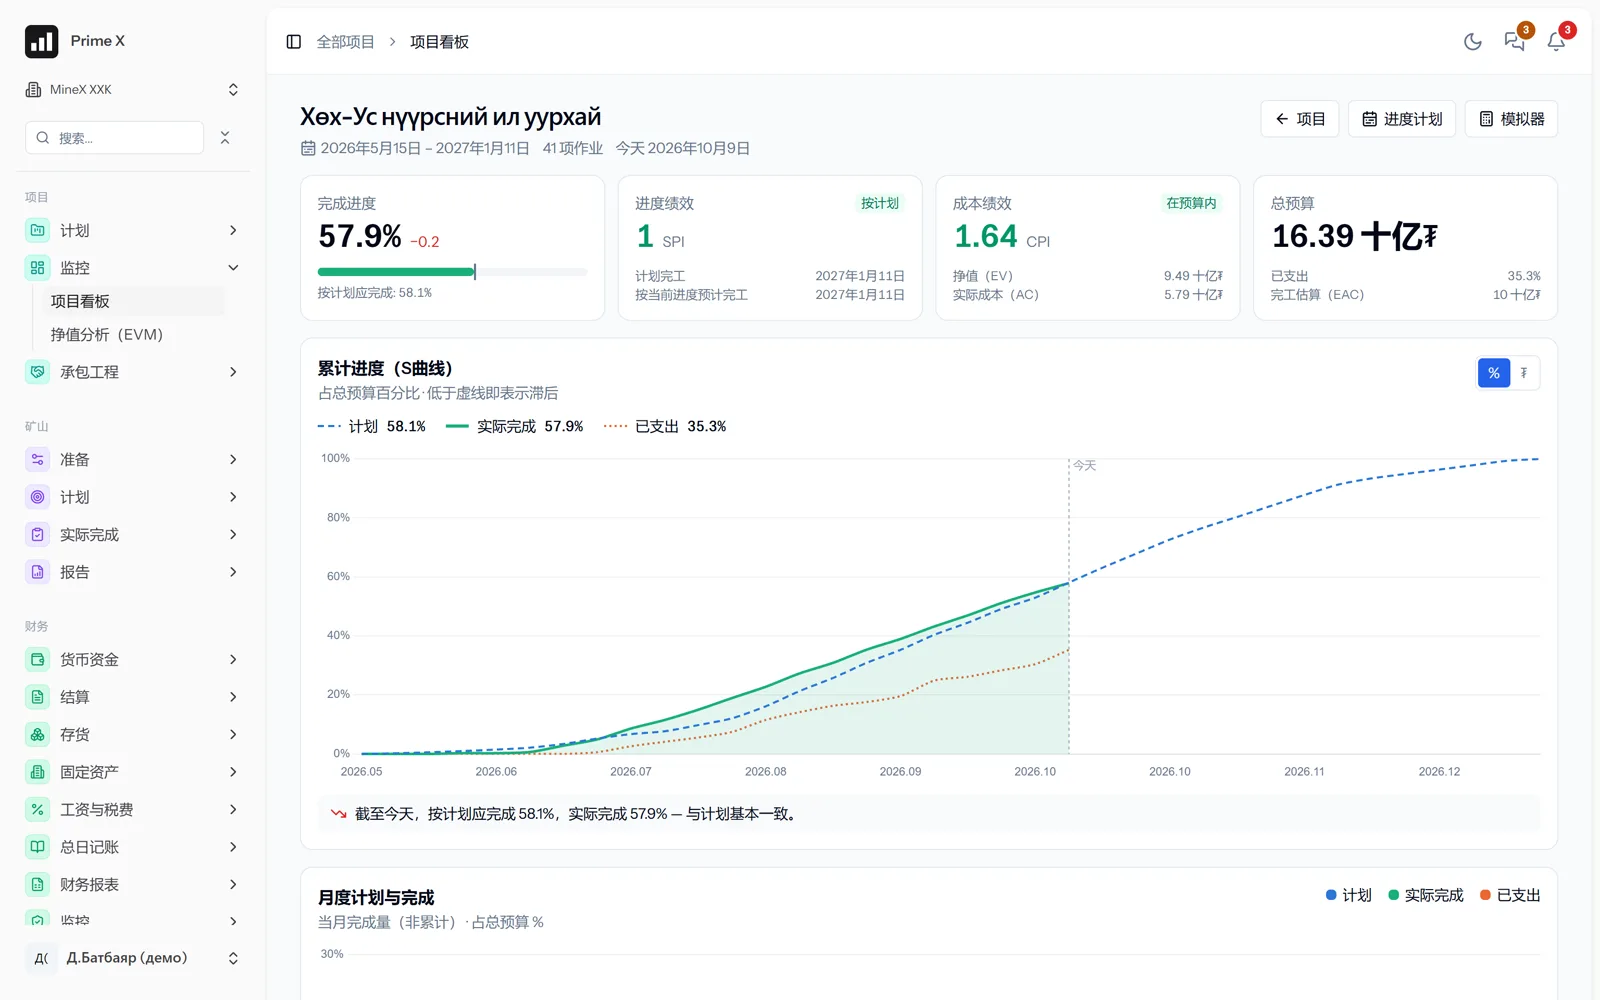
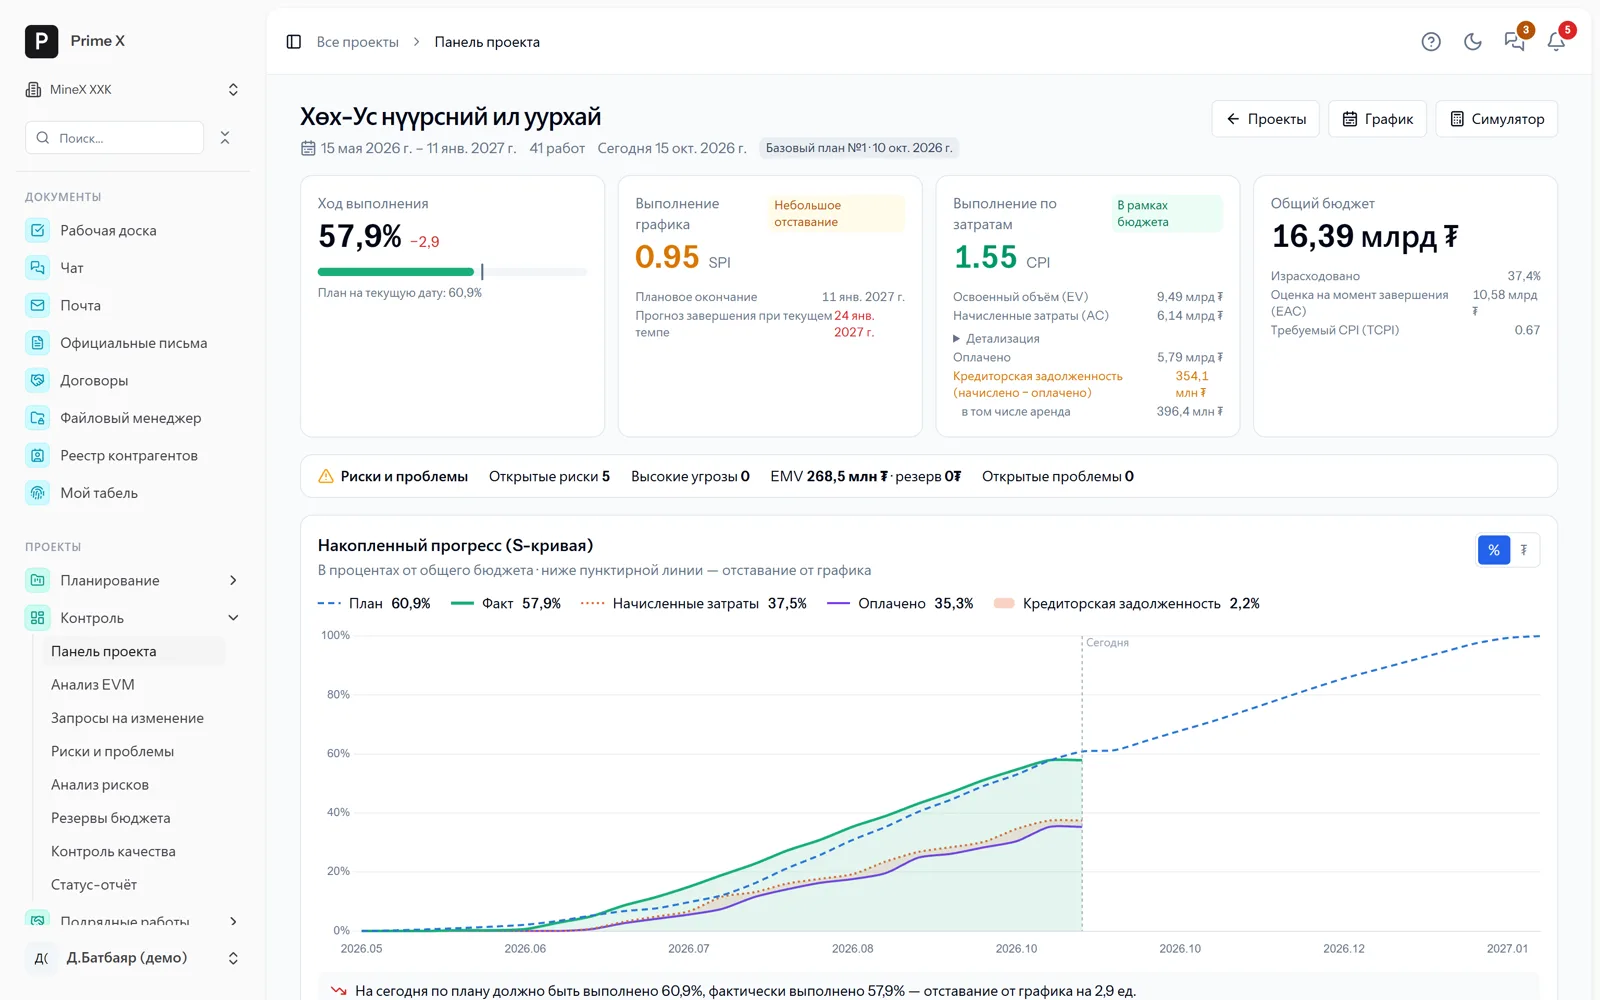
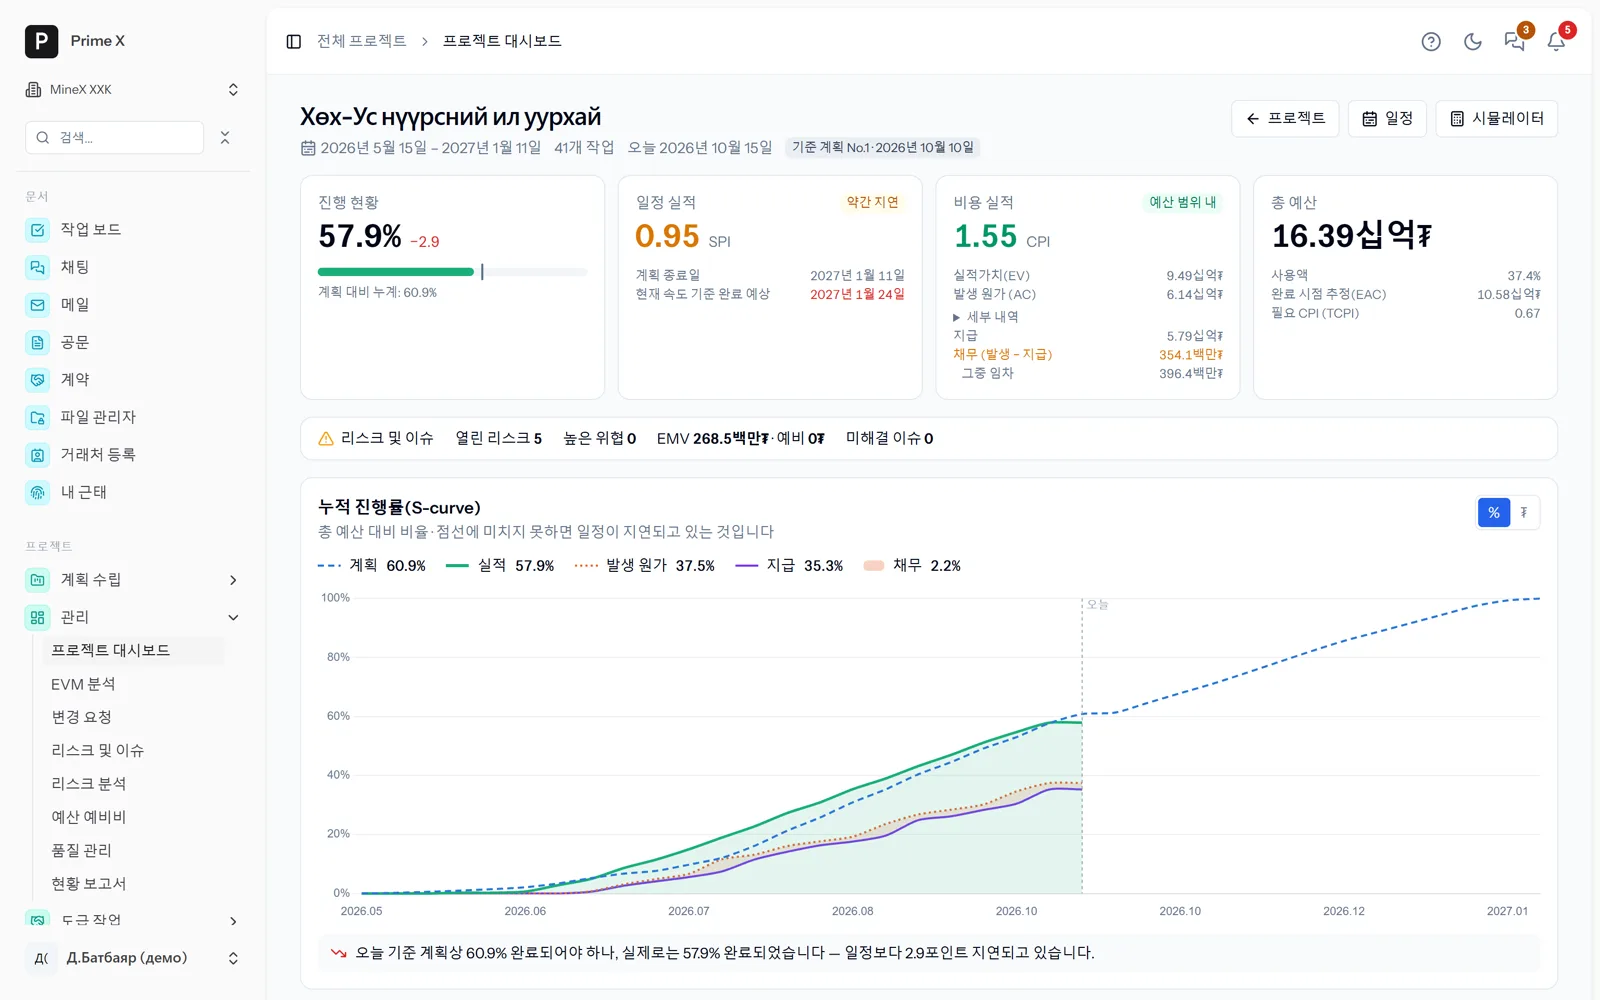
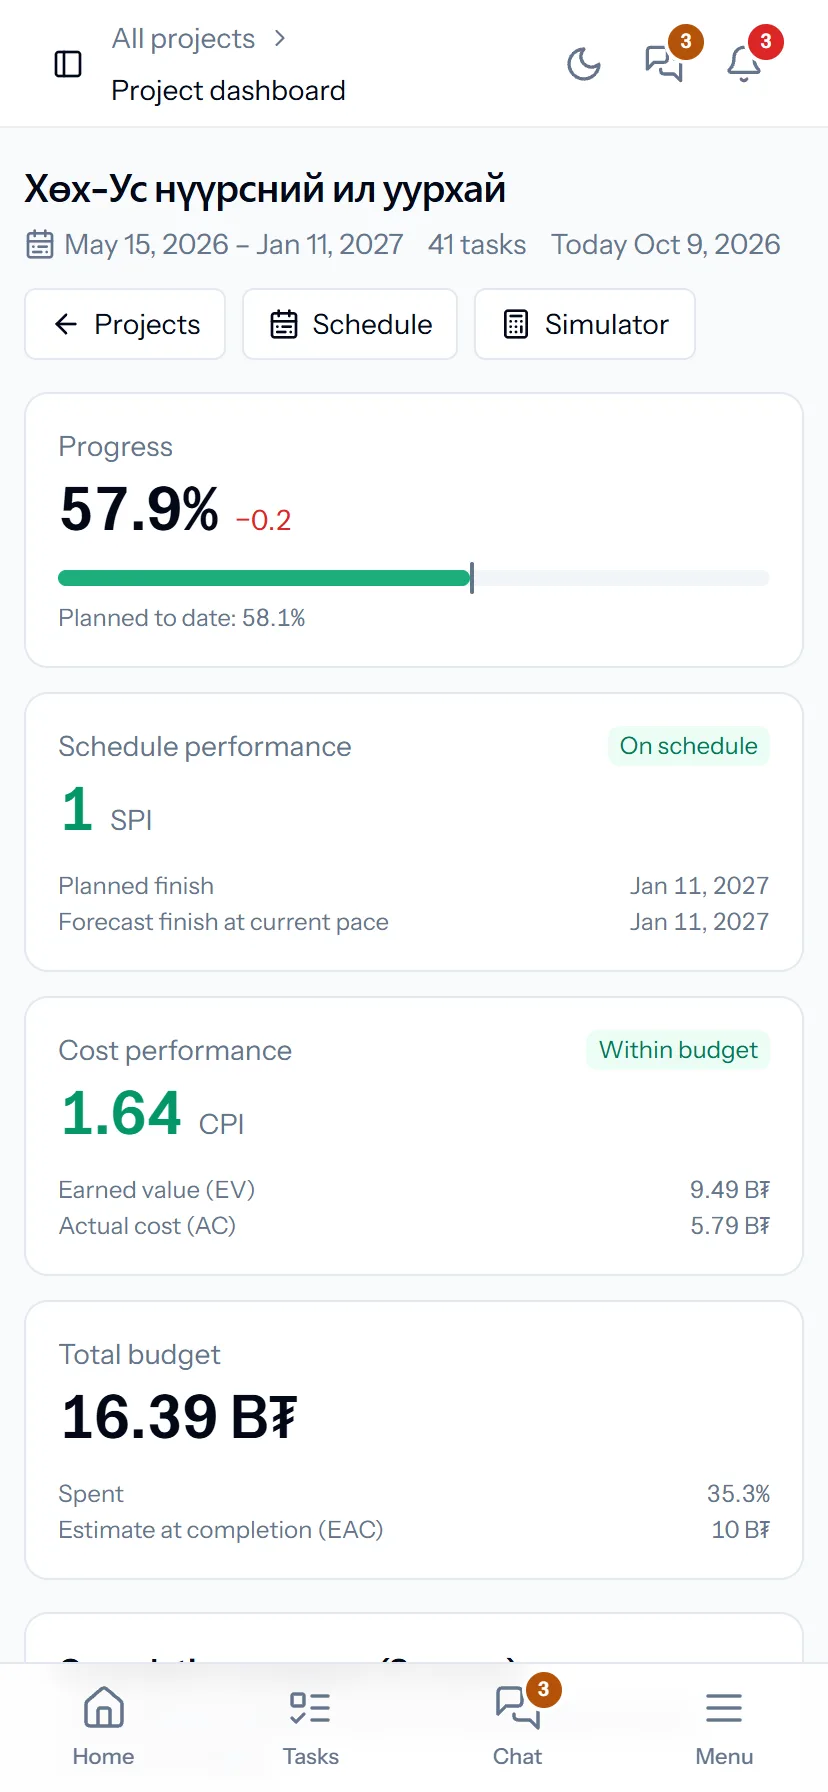
Performance progress, SPI, CPI and S-curve on the dashboard. Invoice from the act, ledger entry from the invoice. Record once, every report automatic.
- Dashboard: progress, S-curve, CPI/SPI in real time
- Invoice from the act, ledger entry from the invoice
- Record once, every report automatic
- within budget
- CPI 1.64
- total budget
- 16.39 billion
- ledger balanced
- Dr = Cr